About this Blogsphere:

This blogsphere attempts to capture, catalog and share resources relating to visual perception of information. It is about a world mostly dealing with Physical (Touch, Taste, See/Sight, Smell and Hear) and sometimes Metaphysical (and that is none-of-the-above category). Physical, for instance, touch (e.g., feel, felt, found), look and visualization, is here with an attempt to combine verbal, vocal and visual--to synchronously see, hear, share and do much more. Interestingly, in order to visualize one does not need special skills, competencies, etc. It is all about common sense, especially with human visualizations. In short, "information is in the eye of the beholder." Continue reading much more all-ado-about this Blogosphere

Akbani is a Cutchi Memon family name.

December 26, 2006

A Visible Pathfinder for Increasing Blog Traffic in 2007

The wise learn from their own experiences but the truly intelligent will learn from someone else's!" - Benjamin Franklin.

My 2007 resolution for return-on-investments in blogging is to have a two-way traffic. The prescription is, please:
1. post a comment--aka, visual signature--in this blog on whatever subject (spam and phishing EXEMPTED)
2. turn on your blog comments' button; I will reciprocate not once, but every post that you create in 2007. This is my own idea of live and let live. I do reciprocate; my 2006 ledger shows Bloggers, such as, Sukhdev Singh, K. G. Schneider, Nancy White, Nirmala Palaniappan, David Tebbutt, Peachy Limpin, Thomas Brevik, Steven Edward Streight, Neil Patel, Diane Levin, and more.


PUNCHLINE: Increasing Blog traffic is a major concern, even for many Gurus [e.g., Adrian W Kingsley-Hughes' Three simple actions that doubled my website traffic in 30 days]
Previous post:
  • Visualizing Comments on Blogs
  • Visualizing Traffic At My Blog Via Mapping The Pathways
  • Blog As A Teaching Tool

    Idea courtesy: Bloggers Compose Their Yearly Ledgers, By Jeralyn; and How to Pay for Blog Comments, @ usability blog of John S. Rhodes; So what'd you get? by Ryan Block


    Technorati Tags: blog comments   2007 blog   blog traffic   2007 resolution   2007 blogging     popular bloggers   popular comments   top bloggers   Reward-program   return-on-investments

  • December 22, 2006

    Now faces are not deceptive: Advances in information visualization

    Your face is the password!

    BANGALORE: Lenovo’s new 3000 Y series notebooks Y300 and Y500 launched today in India have incorporated a unique feature of biometric face recognition technology.

    This face recognition technology takes a digital snapshot of the user, extracts key features of the users face and creates a digital map that becomes the system’s “password”. Continue reading the full story @ CyberMedia India Online Ltd. (CIOL)

    The face recognition feature is supported by veriface software. The technology recognizes multiple users and logs onto the windows operating system and other applications without requiring users to remember a single password. In the event of an unauthorized attempt, the notebook photographs the user and stores the image in a log for verification.

    December 09, 2006

    A visual Newsmap

    From News clips, and News in Photos (all static and consuming), and then News in Pictures, and to a far more interactive, dynamic, Web-based streaming and information visualization, is a long trip. But that trip is now over.

    Visual Newsmap has all in one click, and its your click
    concept

    Newsmap is an application that visually reflects the constantly changing landscape of the Google News news aggregator. A treemap visualization algorithm helps display the enormous amount of information gathered by the aggregator. Treemaps are traditionally space-constrained visualizations of information. Newsmap's objective takes that goal a step further and provides a tool to divide information into quickly recognizable bands which, when presented together, reveal underlying patterns in news reporting across cultures and within news segments in constant change around the globe. Continue reading or LAUNCH

    November 20, 2006

    Visual Search Plus

    New E-Commerce Search Engine Ditches the Text, November 10, 2006 7:55AM

    Like.com uses face recognition technology; it looks inside a photo and creates a digital signature that describes the photo's content and enables a more accurate search for similar looking items.


    Now you can search images... i.e., information visualzation re-vitalized by a Web 2.0's team of Indian Guru: Munjal Shah @ Like.com [PS. riya -- Arabic word for hypocrisy, or ostentation or show-off in a egoistic sense; the following is not that riya, rather this is all-ado-about best practices]

    What others say:
    "AI is also being used at Riya to find photos by matching on characteristics - density, patterns, colours" says Gwen

    "Like.com is from the creators of Riya.com,which in short, is a photo sharing storage system with some smart AI(artificail intelligence). You dump in a thousand plus images in, tag a few, and riya starts to recognize images of people, puts them in groups, and automatically tags them over time. Riya recognizes colors, images, text, faces, and much more. The more people that do this and share their images, the better. Imagine seeing all those pictures of yourself from other peoples cameras during those holiday vacations you walked into!" continue reading @ designverb


    More in the news:
  • Star Search: Shopping Site Uses Visuals ECommerce-Guide, United States - 15 Nov 2006
  • Click it & Ship it Window shop celebrity styles on Like.com Lowell Sun, MA - 14 Nov 2006
  • Google vs. Guruji.com - A Desi Perspective on Search Engines Desicritics.org, India - 12 Nov 2006

    My previous post:
  • visualization - ebscohost’s cool new integration of grokker
  • information visualization at eurekster, a swicki search engine
  • wheels for google, google on wheels
  • surf maps: visualising web browsing
  • dontclick.it - web usability visualized
  • Searching Is Polarized; Will The Five Laws Get a New Revised Version: Every Search Engine Its Searcher

    Technocrati Tags:
    Visual search
    riya.com
    like.com
    index images
    searching_images
  • November 08, 2006

    Whirling around the blogosphere to see what's up!


  • Information Visualization - Web of Idea Nodes
    I’d like a 3-d, navigable, web of ideas. Much like TiddlyWiki which is “a non-linear personal web notebook”. Only I’d like my creation to be visual. I want to see the nodes connect, like a mindmap (like FreeMind).

    This is a diagram (click for a better, larger real example of the diagram):

    Each node in the web would be an idea. The highlighted node would be displayed in full. Linked nodes, depending on their degree from the highlighted node, would display limited information.
    Each node would contain:

    A title
    (eg “Changing Media”)
    On all displayed nodes
    A summary
    (eg “Data decay is accelerating man’s fall from the Golden Age by obscuring the Great Conversation [GC].”)
    On nodes directly connected to the highlighted node.
    The idea explained in full ...


    This is a tool that visualizes semantic categories, in a 3D context--title, summary and explanation.

    For a librarian it is all about cataloging the content, viz., title of the document, description of the document, analyzing the content.

    While these look-alike, but there is creativity in 3D visualization--are librarians also creative?
    PS. I do admit that all librarians are not alike.

  • Information Visualization [Live Blogged Notes from UX Week 2006]
    [Michal Migurski of Stamen]

    Data Viz: Why Now?

    Because the tools and the audience have caught up.

    Starting with Map of the Market from the let nineties. This was inspirational but largely alone. This tree map uses size and color.

    Our palette of visualization is pretty sparse.

    So why now? ....
  • October 23, 2006

    Visualization - EBSCOhost’s cool new integration of Grokker

    This is an old news. Ya.
    But, a new perspective. I felt I had done my 2 cent's worth by including Grokker's feature in Web search visualization. But, now I find Grokker is with EBSCO and moreover, incorporated in the library search menu (precisely for searching in EBSCOhost’s databases), as described below:

    Visualization. This is what actually inspired this series of posts. I went to a demo recently of EBSCOhost’s cool new integration of Grokker (which my library supposedly has a trial subscription to, but it isn’t working right now). Grokker allows a multidimensional visual representation of search results, which includes clustering. If you’re not familiar with the concept, check out Grokker’s website. The whole thing is difficult to explain but incredibly simple to use. I wish Ebsco had adopted this 4 years ago; grad school would’ve been a whole lot easier.

    The beauty of this type of visualization is manifold: It allows the user to see relationships. It allows the user to more easily refine searches based on immediate visual processing of results, and with other included tools like a time slider. It doesn’t require users to scan through page descriptions, which often are poorly written and not representative (less of a problem outside of the web). Most importantly, IT ISN’T UGLY, so users are more likely to use it. During the last usability study of my library’s website, users uniformly avoided using the “search this site” box because the results it returned were ugly and confusing, which is pretty difficult to avoid with text-based results. (I can’t even imagine the confusion they would’ve encountered had I tested them on our digital projects search engine; hopefullly we’ll be testing that later this year.) This is no way to treat users! continue reading @ digitize everything on searching Sweet Jesus, I hate (most) search interfaces! (part 2)


  • Visual Searching (in Flikr and EBSCO: above image), Posted by gsennema
  • Visualize This, By Judy Luther, Maureen Kelly, & Donald Beagle -- 3/1/2005, Library Journal [look for visualization, visualizers, visualizing tools, and corporate support for visual search]

    And the following news, re-read:
  • Groxis and EBSCO Publishing Partner to Provide Visual Search Technology
    Grokker Visual Search Now Available via EBSCOhost®

    My Webliography on Visual Catalogs:
  • Innovative Practices to Connect Every Book, Its Reader
  • Mining The Library Catalog
    My previous posts:
  • Information visualization, 23 Dec 2005 by Mohamed Taher
    For Yahoo search results via Grokker
  • Information Visualization Demystified, 16 Mar 2006 by Mohamed Taher
  • Visualizing the Innernet or Visual Display of the Website's ... 13 Jun 2006 by Mohamed Taher
  • October 03, 2006

    Guess your age?


    Outsell's Chuck Richard says "show me your primary information interface and I'll guess your age." Desktop = AARP member; Laptop = Baby Boomer; PDA = Cast of "Friends"; Cell Phone = more than three body piercings and sooooo under 35; Internet-connected video game console IM'ers = 14-to-28-year-old single males. continue reading


    My previous post on historicity:
  • History of the book: Writing on the Stone Slab
  • Information Visualization: From Aristotle, Plato, to the year 3706
  • September 26, 2006

    Today's rant - Touch it...

    judith meskill's knowledge notes...

    on knowledge notes...
    ...all abstract knowledge is only a faded reality: this is because to understand the world knowledge is not enough, you must see it, touch it, live in its presence and drink the vital heat of existence in the very heart of reality...

    Hymn of the Universe by Pierre Teilhard de Chardin

    September 21, 2006

    Communicating via graphics - Information Visualized

    Thus spake Dave, The Industrial Librarian, at his blog:

    I've discovered a great blog, Creating Passionate Users. This blog is worth checking out for the graphics alone, which are great at capturing the essence of the blog posting (very handy for those of us only scanning the postings....) Thanks Dave


    NB. By the way don't miss another graphics, creative visualization of The indexed Blog, whose profile states:
    This site is a little project that lets me make fun of some things and sense of others. I use it to think a little more relationally without resorting to doing actual math.

    September 14, 2006

    Information visualization and Documentation of the Infostructure

    What are the trends in information visualization? It is time that some effort is made to document, what, where, when, which, who and how of the information visualization is taking place. The following is one such trend and discussion:
    Information visualization conversation with Fernanda Viegas and Mike Migurski

    ""(...) if you look at the academic information visualization community, researchers aren't focusing on the social side of their applications. Infovis folks love to explore techniques that allow them to scale the data they are showing. But what happens when you scale the audience that's looking at a visualization?" (Peter Merholz - IDEA 2006 Blog) Continue reading


    Information and data visualizations seem to be taking off as artifacts suitable for sharing. I’m reminded of the buzz a couple years ago around extisp.icio.us, which visualized your del.icio.us tags (and this before the prominence of tag clouds). This allowed you to create a kind of visualized avatar of yourself. (Which in turn reminds me of “Personal Dictionaries”, an art project from 1995, where people’s additions to their word processor’s dictionary were overlaid on their photograph.) Keep reading

    September 02, 2006

    New this month - Come September

    My book just released.
    This book in short deals with what appeals the matter, as traffic of ideas & bandwidth in business world; and what appeals the soul, as a journey towards the transcendental in order to get the required spiritual care for our daily life)

    Click here for details:


    Cyber Worship in Multifaith Perspectives, Mohamed Taher


    August 24, 2006

    Tactile and Virtual - Sense and Essense of Books


    If, for the philosopher, existence precedes essence, and choice precedes being, for the bibliophile, the tactile always precedes the virtual. It is no wonder that people print out emails that are important to them. The physicality of paper is a more certain hedge against mortality than pixels on a screen.

    The presence of a beloved book in our hands has no virtual equivalent. It should not come as a surprise, according to one study, that depression levels rise with the more time people spend chatting online. continue reading: Now, We're Just Like Them By William H. Wisner — August 15, 2006

    See my article on Virtual librarianship

    Technocrati tags:
    virtual libraries
    Traditional libraries
    Paperless society

    August 16, 2006

    Surf Maps: Visualising Web Browsing

    An Atlas of Cyberspaces - Surf Maps:
    Visualising Web Browsing


    An atlas of maps and graphic representations of the geographies of the new electronic territories of the Internet, WWW and other emerging Cyberspaces."


    Contents include:
    | Introduction | Whats New | Conceptual | Artistic | Geographic | Cables & Satellites | Traceroutes | Census | Topology | Info Maps | Info Landscapes | Info Spaces | ISP Maps | Weather Maps | Wireless | Web Site Maps | Surf Maps | MUDs & Virtual Worlds | Historical |
    See also:
  • Squint-free web-browsing, at Teblog, David Tebbutt on cooperation, collaboration and communication
  • “visual search” @ Pixsy Corporation


    Technocrati Tags: Surfing
    Visualizing

    Googling for more sites

  • August 12, 2006

    Visualizing Words by Colors, Alphabets and Design

    In the following are two dimensions of visualizing the Alphabets. First, by color (Addled Librarian for this link) and second by images (courtesy Flickr)


    Color Code: A Color Portrait of the English Language
    http://loop.aiga.org/resources/loop/loop9/colorproject/index.html

    "An interactive map of more than 33,000 words; each word has been assigned a color based on the average color of images found by a search engine. The words are then grouped by meaning, and the resulting patterns form an atlas of our lexicon."


  • Alphabet Mosaics at Flickr
  • A is for... (Flickr alphabet)


  • Alphabet Sentence thingy
    Just post one sentence at a time and it has to begin the the next number in the alphabet. (I'll make one starting with A, the next person B, etc.) When we've done all 26 letters (or however many are in the language you speak), we'll, how about, It starts with one letter and ends with the next? ok here we go.

  • Spell with Flickr

    My previous post on Word and Numbers:
  • Scientists study Christie success - Quantification to see true color of words
  • Lulu Book Title Analyzer - Another perspective for the visualizers
  • August 07, 2006

    DontClick.it - Web Usability Visualized

    dontclick.it - Institute for Interactive Research


    "Navigate the Web in a different way..." Thanks The Addled Librarian for this link.

    Here's a bit more info on the site:
    The site's technology also allows the developers to keep statistics that will inform them about how many users can actually resist clicking while visiting the site.
    "We do not only record the site visits. With every visit the first click that happened will be recorded as well. The relationship between these two numbers tells us, whether people can resist to click within this interface, or, if they just click the next thing that looks like a button because they are determined by their clicking habits."
    Check it out, and see how long you can resist the temptation not to click. Thanks to Capulet Communications for this visualization


    See also:

  • Usability In The News: DONTCLICK.IT: What a clever idea. A never click your mouse interface. But what happens when you are trying to select an item out of a list? ...
  • Dontclick.it: Demonstrating an alternative web user interface ... Alex Frank's dontclick.it site demonstrates a mouseless user interface. The site requires Flash (you'll quickly see why this is so).
    I got the hang of the "clickless" navigation straight away. But, boy, does it feel weird. Alex's design demonstrates that some aspects of HCI interaction have become very, very deeply embedded ...

  • NB: This is not Mouseless Browsing It is all about navigating with a click-free concept.

    August 04, 2006

    Market Visualization Software - Its for free

    What's making news now:

    Free OS Visualization software from Microsoft Virtual PC 2004 and ...
    The OS Virtualization software Microsoft and WMware now giving away one of its virtualization ... The WMware is the market leader for OS Visualization. ... Plus more both download software is old version. but worth for try it out if you ... continue reading

    See also: my previous post
  • information visualization and its applications, + a growing base in all areas of life, business, etc.
  • God.com: Web Analytics Series no.2
  • Beliefnet.com: Web Analytics Series no.1
  • Market Research Resources via Libraries
  • Business of Blogging Report 2006
  • First Impressions Last - Webmetrics visualized


    Technocrati tags:
    Blogs: Market Visualization

  • July 29, 2006

    Wheels for Google, Google on Wheels

    Here, visualization of Google is neither about physical wheels nor about googling for a four wheel drive.
    No way.
    Google is going fullspeed and needs no wheels, as yet. This post is not even about the Google's Wheel of Fortune!!! And, it also not about what is in another blog: Google: Won't Re-Invent the Wheel or the Browser
    In short, it is none of the above.


    What is below is another spin of the wheel--Spinning in alpha-numeric terms.

    By the way. Wheel has its own ax (or axe) and like all the holy words, wheel has secular, spiritual, magical and mystical dimensions. First the transcendental nexus:
    "Chakra in Hindu means "wheel." In Buddhist, Jainist, and Hindu beliefs, Chakras are vital energy centers in the body. continue reading"


    And, now the alpha-numeric, with a slant towards digital inspiration:
    Information visualization of Google using the wheel gives extra energy to this virtual domain.

    See the following two samples:
    Google Number Wheel by Philipp Lenssen, July 28, 2006


    Google Alphabets Wheel: English Alphabets in Google Search Results by Amit Agarwal on 7/29/2006

    Inspired heavily by Google Number Wheel that's a brainchild of Philipp Lenssen, here's a different version of Google Wheel for English Alphabets.

    It is easy to read the graph. Each pie segment on the circle denotes the number of Google search results for a particular alphabet. For instance, Google Web search returned 24 billion documents containing the alphabet "a" while just 1.7 billion results for alphabet "q".


    From my own blogs:
  • Web Analytics - A Librarian's Outlook
  • Web analytics @ Multifaith Information Gateway
  • July 28, 2006

    Get a free book - Courtesy: [Geeks are Sexy] technology news

    Wish to get a free book? Read the following -- (incidentally, this Geeky blog is among the top ten Blogs Of Note, today Aug 1st 2006):


    Contest: Get a FREE book from [GAS]

    A few days ago, newfound buddy Chip from Chip’s Quips decided to run a "get a free book" contest on his blog. He asked people to give him a few reading suggestions, and the person who suggested the book he would pick as his next read would end up winning the contest. The Prize? One book of a value of less than $20.

    I thought that this was a great idea, so I'm going to run the exact same contest. Click here to join the contest

    July 16, 2006

    Visualizing Traffic At My Blog Via Mapping The Pathways

    A running post, last updated Feb 3, 2007.

    This is a sequel to my previous post: Visualizing Comments on Blogs

    I am given to understand that 'high blog traffic flows in' if we are writing about Bill Gates, Deepak Chopra, Pat Robertson, (or "Even something inane and mundane gets to be a hit at times"). Read more on this minsdet in my above mentioned blog post

    Today, I found another site that instructs on this very subject, but in a different way:

    Blogs need SEO too, by Neil Patel, July 05, 2006

    Here are the most common mistakes that I see on blogs:

    1. Most blogs do not have meta description tags. You can find a plugin for your blogging platform that will easily add it to each post. You can setup the meta description tag to automatically pull the first sentence from your blog post.

    2. The URL strings on many blogs are dynamic instead of static. You do not want extraneous characters in your blog.
    http://www.pronetadvertising.com/looking%20forward?to@!the231lit.html
    You want clean URLs like this
    http://www.pronetadvertising.com/articles/looking-forward-to-the-little-man.html

    3. Most blogs state their name in the title tag and then the title of the post.
    PaulStamatiou.com - Search Engine Optimization 101
    The two should be reversed.
    Search Engine Optimization 101 - PaulStamatiou.com. Continue reading from Blogs need SEO too


    Measure Map Feeds - and a new Widget
    Looking for better representation sources, I found this write up on widget. And, I signed up for Google's venture: Measure Map. But, I don't have access to it, as of now. I believe it helps in visualizing the blog traffic, graphically. If you know of any similar tool (other than Google Analytics) please let me know.

    See also:
  • blog-a-nomics, Gale Martin
  • 16 Ways to Drive Traffic to Your Blog
  • Google: traffic, blog
  • Technocrati Tags: blog traffic
  • del.icio.us Tags: blog traffic
  • Weblogology: The Study of Blogs
  • More on Weblog theory

    Punch Line:
    Two views about the repeat visitors
    Repeat visitors are not a good measurement either - I used to visit Toronto.com a lot, but only because they were really the only game in town. Did I like their site? Not really ... but I kept coming back out of necessity. Continue reading: AJAX Feedback Mechanism

    I looked at your traffic stats. What do they tell you? How do you interpret the fact that you get almost NO repeat visitors? Study some A List, high traffic blogs in your field or just in general. What are they doing that you might consider doing? Continue reading

    With malice towards none: My repeat visitors in one day (i.e., today) is 12%; and since birth of this blog, repeat visits are 34% on the whole.

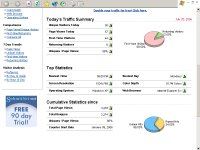
    Now, do you have any comments on the above two observations and this real-time picture of my blog's traffic, as seen below:


    See my previous posts:
  • Blog As A Teaching Tool
  • July 05, 2006

    Visualizing Comments on Blogs

    This is a running post: Updated 10 Feb, 2008:


  • Probing the Nature of Blog Communities
  • 5 ways to get more comments and make you smile February 24, 2006 @ Blog About Your Blog
  • Of comments and commentators @ Sayesha's world
    [see: The casual reader, The friend, The banterer, The loyalist, The silent reader, The 'almost there.' The judge, The mistake finder, The 'I've given up' blogger--Which one are you?]

  • Review: Naked Conversations, the stark naked truth about blogs, Information World Review
    A readable book that converts you to the power of blogging
  • Visualizing Web conversations using Talk Digger, by Frédérick Giasson, August 3rd, 2006
    In only 30 minutes of conversation browsing, I noticed 7 interesting use cases (patterns) in the system. I will present all of them by describing what is happening with each of them.

    coComment keeps track of all the online conversations you're following in one convenient place, and informs you whenever something is added to a conversation. [Thanks Sukhdev for this lead]

    Guardian has an interesting article on how the internet content generation has shifted from 80-20 principle (i.e. 80% of the internet content is generated by 20% of users) to 1-10-89 principle!
    i..e one user creates the content, 10 will "interact" with it (commenting/offering improvements) and the other 89 will just view it! Continue reading Thanks Ashish for this update!

    Here is a summary of how my concern to get a comment has been visualized by bloggers:
    1. Reciprocal Commenting is rare, but mandatory!
    2. You respond quickly and kindly to comments!
    3. ... when a complaint is made against blogging ... well then Hare Krishna! .. respond to it, and improve the situation for everyone...!
    4. One doesn't elicit blog comments by seeking them.

    And my 2 cent's worth responses:
    1. Thank you: I learnt what is mandatory, optional and click for 'next blog'.
    2. That is your speed to check your traffic. Godspeed you have, I mean.
    3. Hare Krishna... is this a Mantra for Bloggers to initiate communication
    4. I thought the basic lesson in life is seeking: Seek and You Shall Find; Ask and You Shall Receive. If you hadn't sent me an email on this wisdom, I couldn't have visualized your mind. Are you a Charismatic guru with 3D transparency (as an open source) to enable viewing mind waves!!!
    And don't have to say any more. The following comment about a comment says more than enough:

    Some people are like potatoes
    There are those who are content to watch while others work they are Spec Tators. Some never help, but are gifted at finding fault and tell others how to do it they are called Comment Tators. Source: www.enidnews.com, cited in

    Today's rant (a comment I just found):
    Interesting post, .... I had something interesting to say, but it took me so long to register for TypeKey I forgot what it was. {and now that blog post in only in google's Cache}

    From a Survey on blog comments:

    After reading the whole survey — or my selected excerpts — a question remains: are comments a good indicator of the success of a blog? As they remain invisible for the most part — you have to visit a blog and voluntarily click the “Comments” link of a post to read them — it seems that comments are only important to the blog owner and to the commentators themselves. Continue reading the survey @ Blogs for Companies, by Roland Piquepaille, April 10, 2006

    Why I don't get comments on my blog? Asked a friend of mine? His blog has a few multilingual and multi-disciplinary posts.

    I told him to read the following two comments from experienced bloggers:

    First, from Andrews's excellent post on infrastructure (including essence, nature, style, design, etc), presence or absence of comments. He has a detailed note on what makes presence of comments a value-added factor in blogs. I like the closing words in his post:
    May be you have a comment on Jacobs' comments about comments. If so, leave a comment in my comments, and I'll try to comment on your comments.
    Second, from G V Krishnan (a.k.a GVK), a well-wisher of mine, who responded to my complaint, among others, on two areas: a) why bloggers are so casual about commenting or responding to comments; and b) why no traffic at my blog. I really enjoyed reading his post. One needs time to read this eleven paragraph classic lesson in blogging .... [pl. ignore his golden rule, mentioned in this sermon: "A blog reader's attention span doesn't exceed three paragraphs."] Below is an extract from his post:
    Dr. Taher's latest lament is that no one takes note of his blog, self-billed as the world's first website to spread the 'multifaith' message. He had sent out a press announcement about his blog to some 300 plus print and online news sources, including western TV channels. None of them appeared interested in Dr. Taher's recipe for inter-faith tolerance, religious harmony and sustainable global peace...

    Dr Taher would have had better showing in the media, if only he had taken to blogging Britney Spears or the Brangelina baby birth in Namibia, Multi-faith wouldn't have a chance. What does Dr. Taher think he is? Dr Deepak Chopra? Or Pat Robertson? But then blogging empowers each one of us with a computer keyboard and Internet connection to reorder the world....

    To get noticed you need to blog something that interests other bloggers. Even something inane and mundane gets to be a hit at times. Blogger Glacier who commutes to San Francisco blogs his observations during his daily train trip in BART (Bay Area, Calif., rapid transit that covers four counties and carries 320,000 passengers) in Bartrage.com. It is accessed by over 25,000 readers a month...

    Dr Taher is a well-meaning guy with a mission. But then good intentions and lofty ideals count for nothing in the mad, mindless world of blogging. At a recent convention of bloggers held in casino capital Los Vegas they came to a consensus on ground rules for blogging. What is acceptable in blogging is polemics, provocative thoughts, bragging, and grandstanding. Plagiarism is okay. Haven't we heard pundits saying, blogging is like golf? You can cheat, but you need to be polite about it. Continue reading Dateline Mysore: Bloggers Don't Drip Like Leaky Tap by G V Krishnan
    These two citations apart, I continued my search for a better understanding if it is all ado about sense making or total nonsense. Luckily, I found two blog mindmaps. Both use creative visualization skills to show how Bloggers converse. The title of the first post is Weblog Conversations. This post is cited by at least three other blogs, but received a single comment. (Another blogger re-worded this title and called it, Visualizing Blog Conversation). The second minmap is a slightly different type, by Nakajima. Nevertheless, for all those who are interested in information visualization (including areas such as, data mining, conversation behavior and communication patterns) of blog comments the above two are excellent mindmaps. These two graphical images can be viewed in a comparative perspective at Data Mining Blog. No comments at this Data Mining post, please note.


    My research also found the following:
    One blog started a year ago, Comments Blog, and wanted to know expectations of bloggers who read his posts. This poor blog has received no comments, whatsoever.

    Some Other Comment Blogs:
  • Blog Comments Revisited
  • on blog comments
  • How to Pay for Blog Comments
  • Blog comments and SEO
  • Seth Godin on blog comments
  • Blogalysis=Blog+Analysis
  • State of the Blogosphere, April 2006 Part 2: On Language and Tagging
    Posted by Dave Sifry on May 01, 2006
  • More On Sense making
  • Some continue asking the same question: Why No Comments

    P.S. Whatever is the debate, libraries are now cataloging comments. One of these citations seems to be a good model, viz., Public Commenting on Organizational Blogs or Websites. Albeit, posted almost a month ago, it has no comments!!!
  • June 29, 2006

    To perceive other viewpoints or to see things in new ways

    Thanks. I found a great reflection for those whose stream of consciousness lies in information visualization.***

    See Diane Levin's blog for her visualization on this article:

    Back to the future: South American indigenous Aymara people have mirror-image understanding of time,
    One of the benefits mediation affords to participants is the opportunity to shift their perspective--to perceive other viewpoints or to see things in new ways. [And much more about this story on Back to the future... ]


    See also blogs that are busy with this concept

    The Punch Line:
    Just-in-case you thought the world is only in the Northern Hemisphere, please bear in mind, there is a Southern Hemisphere, as well.
    See a Tamil context of this time (one of oldest language, culture, and civilization in India):
    As a native Tamil speaker, I find this fascinating, because we have very similar linguistic references to time. Consider these Tamil words and sentences ... continue And, you will find, herein, a comment from another Tamil scholar attesting this historicity of Back to the future from the Tamil point-of-view.

    And, just-in-time if you already have all this understanding, please proceed and visualize something different, but from an East-Asian cultural context. Click here: The Sensor Clock: Please Keep Jokes to a Minimum

    ***UPDATE: A coincidence - After I published this reflection, I came across another blog, whose title is: Agelessbonding, and whose subtitle is: What I see from where I am and how I see it. Continue reading from Agelessbonding [Note: this blog exists, almost, since three years: 10/01/2003]

    June 27, 2006

    Carl Jung's Conceptualization About Thinking, Feeling, Sensation, Intuition

    How close is this to our notion of Information Visualization?

    I just came across a Web site that deals with the Jungian notions of "The Functions: Thinking, Feeling, Sensation, Intuition"

    This Jungian article comes with a title: Transpersonal Pioneers: Carl Jung, [published by Institute of Transpersonal Psychology • 1069 E. Meadow Circle Palo Alto, CA 94303]
    The article deals with themes such as,
    The Attitudes: Introversion and Extraversion
    The Functions: Thinking, Feeling, Sensation, Intuition
    The Unconscious
    Archetype
    The Ego
    The Persona
    The Shadow
    The Self
    Symbols
    Psychological Growth: Individuation
    Evaluation
    Recent Developments: Jung's Influence
    References

    An extract:
    One of Jung's greatest contributions to psychology is his theory of type. Jung found that different people think, feel, and experience the world in fundamentally different ways. His type theory is a powerful tool to help us understand how people function.

    Jung identified four fundamental psychological functions: thinking, feeling, sensation, and intuition. Each function may be experienced in an introverted or an extraverted fashion. Generally, one of the functions is more conscious, developed, and dominant. Jung called this the superior function. It operates out of the dominant attitude (either extraversion or introversion). One of the other three remaining functions is generally deep in the unconscious and less developed. Jung called this the inferior function. see full text


    What I think is Information Visualization as a process, technique, thought and action is so close, in theory and in practice. But how close, or how far. Any comments from the Gurus of Information visualizaiton?

    P.S. Librarians, I was trying to find more info on books about Jungian connections with Buddhism, Hinduism, Islam, etc. And, in this process Google led me to this Web site, and in fact there is much on the Multifaith context in this visualization of the threads that connect the East and the West.

    My related post:
  • Toxicity in the library workplace - a survey
  • Emotional Communication Interface - Revisited
  • June 25, 2006

    What is the True Color of the World Wide Web?

    It is the dark and light web! indeed, there is much that escapes the Google:
    Content on the Web that is not found in most search engine results, because it is stored in a database rather than on HTML pages. Viewing such content is accomplished by going to the Web site's search page and typing in specific queries. LexiBot was the first search engine to actually make individual queries to each searchable database that it finds (see LexiBot). Also known as the "invisible Web." Contrast with surface Web.continue reading


    Some call it underground Web. See Yahoo Answers

    What Color Should Your Blog Be??

    June 13, 2006

    Visualizing the Innernet or Visual Display of the Website's Infostructure

    Show, don't tell, is the bottom line here.
    Websites have their own faces, features, facets, and factbites. Many are however not visualized. Interestingly, businesses and communication portals are now looking (not just at the surface and beyond), even at the inner self. This soul searching is good and hope it lasts longer. By the way, I am not alone in inviting attention to the Innernet (no spelling error) in a material world***
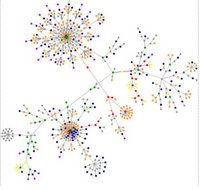
    What follows is a visual of my two blogs' (or Website's) infostructure (not infrastructure, for a difference click here). Click at any of the images, given below and you can visualize the true colors of the content.


    Image on the right: Multifaith Hall of Fame of the 21st century
    Image on the left: Blog As A Teaching Tool
    The meaning of the colors in the above images is well stated by the author of aharef. See the following:

    Acknowledgement: Thanks to Teblog of David Tebbutt for the information visualization tool, viz., Aharef's website-mapper.
    I am amzaed by the way Ted has visualized this graphics: Website Structure (beautifully) Revealed [details]. His tell tale is:
    As a way of highlighting areas for improvement, this is brilliant. It is also quite hypnotic to watch the image evolve.

    Ted has identified another source: Aharef’s Wikipedia site-map. Click and Visualize

    Incidentally, he was inspired by a master visualizer, Guillaume du Gardier. I envy Guillaume du Gardier for his PR and Communication skills. His blog is loaded (I mean it in a positive sense) with all types of graphics, images, and visuals [view here].

    A word about other graphics and applications that pre-date Aharef's website-mapper.
    Knowledge managers have been adopting this sense-making approach in their own ways. See Lennart Björneborn's doctoal work,
    The Corona model with examples of link paths and reachability structures between different graph components in a web space (modified after the Bow-Tie model by Broder et al. 2000) [Details]
    ~~~~Links are for use – the very essence of hypertext;
    ~~~~Every surfer his or her link – the rich diversity of links across topics and genres;
    ~~~~Every link its surfer – ditto;
    ~~~~Save the time of the surfer – visualizing web clusters and small-world shortcuts;
    ~~~~The Web is a growing organism
    quoted in PhD dissertation in webometrics:
    Small-World Link Structures across an Academic Web Space - a Library and Information Science Approach.

    P.S. "I didn't say a word. They did." Thus Spake Feroze Thank you Mr. Feroze for giving me this message in seven short words (amidst your thousand worded blog). You are a creative visualizer (see his blog: my1000words). Thank you also for letting me learn that visuals speak on their own (we don't need to always use a 1000 words).
    ----
    Similar Resources:
    *** There are many more in this stream to give you such an insight:
  • Cover story of the May / June 2006 AIIM E-Doc Magazine, has a lead article on Be Serene: Channel you inner records manager, detials
  • Centre for Spirituality at Work "Fostering good karma a touchy subject; Spirituality is the 'last frontier' of workplace enightenment, but Wallace Immen finds interest in exploding, May 24, 2006 [You may find these articles of interest: An article from the www.Spirituality.com website about our Founding Director, Sherry Connolly, MBA, MDiv, DMin (cand.)]
  • Putting Reflection into Gear, BY : John Baldoni, [ON LEADERSHIP COMMUNICATION] 06/28/2006
  • Vertical and tacit: Multifaith and Knowledge Management in Perspective, details
  • Labyrinths, Sacred Geometry, Innernet & Visualization, details
  • See also: Richmond, Lewis. Work as a spiritual practice : a practical Buddhist approach to inner growth and satisfaction on the job (Broadway Books, c1999)
  • June 05, 2006

    Visual Signatures and Information Visualization

    What is a visual signature?

    Is it your picture, you leave with your comment?
    Is it your comments, per se?
    Is it your logo that you carry?
    Is it your name plate that is visual?
    Is it your brand that is visible?
    Is it the stamp (captured by the web traffic log) that you leave after your visit ?

    An answer, to the above question, could be any one, or all of the above.

    What the experts in the field of information visualization say about it? I am searching. But, as of now, I have no way to quote or cite them. [Google, if you wish Lets proceed.

    Read the following extracts, and you may be able to visualize the true colors of visual signature:
  • I am not who I am, I am what I do (online...)
    We are adding a new dimension to everyone's online persona: what you look like, your "visual signature". As for all the other dimensions (email, phone number, credit card number...), I believe that noone should ever be able to learn anything about me by just knowing what I look like (and vice versa !) more...
  • INTERFACE DESIGN
    Graphic design and visual "signature" graphics are not used simply to enliven Web pages - graphics are integral to the user's experience with your site. In interactive documents graphic design cannot be separated from issues of interface design. Read further...

  • What about Signature?? (requires you to sign in, or take Ecademy Membership to read all comments)
    The themes discussed include: Visualization supports Communication, What about signaure?, etc.
  • Visual thinking practice: Finding your visual voice, by dave gray
    ... Your visual voice is that intangible which makes your sketches, doodles, and whiteboard scribbles uniquely yours and no one else's. You could think of it as your visual signature. Here's a way to discover it. Continue to visualize

  • Gemplus? Lookthatup, By Fritz Nelson
    ...The software can assess color, shape and texture using a visual signature of the image. The technology uses an image analyzer that "enhances, indexes, recognizes and retrieves images." Keep reading...

  • Dynamic Signatures, AQStats.com
    A signature graphic that is compatible with the Battleon Forums as well as phpBB forums. The signature displays the statistics of a character in AdventureQuest. A JavaScript-based signature creator can be used as a visual signature editor. The signature can be created by hand, using the following URL format:
    http://sig.aqstats.com/font:color;line:(color|none);bg:(color|image|transparent);sigtype:style/characterID.(png|gif) Read further...

  • you may be redirected from Visual Signature Verification to the software used for Signature Verification
  • Using Mnemonic TechniquesAs Part Of Pictorial InterfaceFor Self-identification Of Illiterate Villagers, by Dinesh S. Katre details in pdf file

    Anyways. If you are not happy with the above, let me know, I will continue my research. Any comments?
  • June 02, 2006

    Visual Calendar and Information Visualization Contextualized

    What is a visual calendar?
    It is simply a visual show or snapshot of what have you on the calendar.

    Sample Images Google Yahoo AlltheWeb MSN

    There are many ways (as well as tools) to add visual content to calendars. In the following is a list of resources on the subject.

  • Enabling rich human-agent interaction for a calendar scheduling agent, by Andrew Faulring and Brad A. Myers, Conference on Human Factors in Computing Systems archive, CHI '05 extended abstracts on Human factors in computing systems, 2005 Details. [ABSTRACT: The RhaiCAL system provides novel visualizations and interaction techniques for interacting with an intelligent agent, with an emphasis on calendar scheduling. After an agent interprets natural language containing meeting information, a user can easily correct mistakes using RhaiCAL's clarification dialogs, which provide the agent with feedback to improve its performance. When an agent proposes actions to take on the user's behalf, it can ask the user to confirm them. RhaiCAL uses novel visualizations to present the proposal to the user and allow them to modify the proposal, and informs the agent of the user's actions in a manner that supports long-term learning of the user's preferences. We have designed a high-level XML-based language that allows an agent to express its questions and proposed actions without mentioning user interface details, and that enables RhaiCAL to generate high-quality user interfaces].
  • Developing calendar visualizers for the information visualizer, Symposium on User Interface Software and Technology archive, Proceedings of the 7th annual ACM symposium on User interface software and technology, by Jock D. Mackinlay, et al. 1994 Details. [ABSTRACT: The increasing mass of information confronting a business or an individual have created a demand for information management applications. Time-based information, in particular, is an important part of many information access tasks. This paper explores how to use 3D graphics and interactive animation to design and implement visualizers that improve access to large masses of time-based information. Two new visualizers have been developed for the Information Visualizer: 1) the Spiral Calendar was designed for rapid access to an individual's daily schedule, and 2) the Time Lattice was designed for analyzing the time relationships among the schedules of groups of people. The Spiral Calendar embodies a new 3D graphics technique for integrating detail and context by placing objects in a 3D spiral. It demonstrates that advanced graphics techniques can enhance routine office information tasks. The Time Lattice is formed by aligning a collection of 2D calendars. 2D translucent shadows provide views and interactive access to the resulting complex 3D object. The paper focuses on how these visualizations were developed. The Spiral Calendar, in particular, has gone through an entire cycle of development, including design, implementation, evaluation, revision and reuse. Our experience should prove useful to others developing user interfaces based on advanced graphics].
  • Greg Judelman. Knowledge Visualization, Information Visualization, Problems with Current Information Interfaces and more...
  • Calendaring websites reviewed, Journal of Samantha, May 31, 2006

    When in doubt, Ask the Expert:
    Edward Tufte: Ask ET forum - Topic: Visual Calendar

    Applications Side***:
  • Give your website visitors a Visual Calendar of your events, not just text announcements: mini-calendar
  • Sked Visual Calendar [Sked is an effort to develop a visual calendar/scheduling program with the primary interface being text-based (i.e. it runs on a terminal). There seems to be a plethora of strictly graphical calendar programs available, but a relative dearth of text-based ones. Sked attempts to fill that void. The interface principles of Sked are very similar to those of Mutt and Vim, primarily emphasizing efficiency and speed. Indeed, many of the features of those programs will be copied wholesale. Anyone who uses and enjoys Vim or Mutt should feel at home using Sked.
  • Visual Calendar Planner v5.0 Shareware
  • See also from my other blog: Multifaith Calendars - Visualize the Festivals, Feasts, Fasts, Festoons, etc

  • ***Disclaimer: These tools are not tested for quality, applicability and effectiveness. Try it yourself.

    May 28, 2006

    Visual Communication Vistas Revisited

    What a co-incidence (serendipity is not in fashion, any more)!!!

    Oops! Some including the founder of the Web, nevertheless comfortably call this process of finding the unexpected Web resources, as serendipity.
    View his words:
    "You get this tremendous serendipity where I can search the internet and come across a site that I did not set out to look for." Tim Berners-Lee, in Web inventor warns of 'dark' net, BBC News, To Listen to him voice and watch the video here
    But, let me add a message (before it is lost in the medium). I did a post in my previous blog on anti-social networking (READ: Isolatr Vis-a-Vis unifier on the Web ). And, today I found a blog that links social communication using the media and a medium.
    Thanks to Dave for such a thoughtful blog, viz., Communication Nation.

    Anyways, I found three interesting Visual Communication resources:
  • A quote that is very relevant here:
    “The events communicate in a variety of ways -- the spoken word, the visual -- and we don't bypass the opportunity to communicate in the visual. In fact we invest in it. After all, sometimes it's the visuals that get you into the news,” Rob Stutzman at thinkexist.com

  • Communication Nation, by dave gray, Founder and CEO of XPLANE, the visual thinking company.
    Herein, I enjoyed Visual thinking with Legos

  • Visual Mind - Mind Mapping Software:
    Visual Mind is a powerful tool that will help you in your daily work, whether the purpose is business or personal related.

    Through a mind friendly and simple to use interface, you can visualize your thinking, quickly arrange and organize your work, all to benefit you as well as people around you.

    What do you think about this content, as well as, approach to communications? Does the above help you in adding value to business & / or daily life; or what have you to add on, please bring in, asap.

    Note: This is a sequel to my previous Visual Communication vistas
    Similar entries:
  • Books and senses - visualization conceptualized again
  • Guided Imagery / Visualization - Uses with the Cancer Patron
  • The Technique of Song and Sound Visualization
  • See also, my other blog's post: Knowledge Management Applications in Multifaith & / or Multicultural Transactions
  • May 21, 2006

    Scientists and Artists: Who should design learning?

    An interesting perspective, indeed!!! The above title is from an article posted by Gsiemens, at the Connectivism Blog.
    [P.S. Incidentally, I tried to leave my comment on the same page, but the blog requires registration. Hence, I post my comments here. I hope this will benefit all those who have not crossed this creative visualization]
    Thank you gsiemens for the balanced approach in presenting the debate. Also thanks to Deirdre Bonnycastle for highlighting the (intrinsic and extrinsic) value of information visualization. Here, I reproduce the comment by Deirdre Bonnycastle
    Here's a question to ponder "Why are most educational Blogs full of words?" "What is it about the alphabet that consumes educational practice?"

    While it is proverbial to say a picture is worth a thousand words, I would quote the original author (to show the true colors): “Words and pictures can work together to communicate more powerfully than either alone.” This quote by William Albert Allard, interestingly, also supports the reason for the existence of my blog, viz., Information Visualization.
    Back to the article and its debate - who is more competent. My comments are as follows:
    On the question who should design learning, my own answer will be (agreeing with the author), none of the above. I am a librarian, and understanding the process of educating the educators was my Fulbright project (more specifically, it was to get a feel of how user education program was implemented in American libraries, 1989-1990). I have taught library science for over fifteen years -- all without any formal training in the area of how-to-teach! Only recently I took a course (Teaching effectiveness Certificate), to get a look and feel of educational methodology. (Wherein, two courses are taught by a Nursing specialist).

    Permit me to narrate my experience. I did a presentation in the above course. My presentation had three goals, viz., a) introducing the class to blogsphere, b) facilitating visualization of how blogs can be both entertaining and educative and c) present the results of my research on trends in blogging and blog as tool for the educators. View this research survey results at my blog: Blog As A Teaching Tool. At the end of the lecture, as a stimulant, I presented the Blogga song [See details of this on my blog: The Technique of Song and Sound Visualization]. Blogga song is by and for librarians, but entertains everyone.
    What I learnt from this presentation is that the participants were motivated to a great extent by this lecture and the tools that I brought in. A few were familiar with the name blog, fewer had seen it, and finally I initiated them to be bloggers, at the end of day.
    What I infer, from all the exposure and experience is, competencies and skills if shared collectively, and if digested professionally by any one, can result in producing good design and aid in good delivery.
    Recall cases where teachers with master or doctoral degree in education have failed and failed badly in communicating actual sense of learning objectives (L/O) & / Or learning outcome (lot). The debate on the importance of such fundamental concepts continues even in this 21st century.
    My belief is good teachers are not made; they are born.
    Interestingly, the Connectivism Blog -with its subtitle: Theory of how individuals and organizations learn in a digital ecology- has much more content, context and concerns for us as teachers.

    May 19, 2006

    Blog-to Show

    I found a very interesting blog. Anyways, are you ready for the Blog-to Show this weekend May 20-21 - [my shout] This is Last and Final Call!!!

    The details of the show are:

    We’re having a Blog-to Show Saturday and Sunday. Here’s what you do.

  • Write up a sentence or two about what makes your blog worth visiting.
  • Write up some advice or a short bloggy quote that you think other bloggers would like to know.
  • E-mail that information to Liz at lizsun2@gmail.com

  • All the best.
    For more visualization-cum-creativity visit Successful Outstanding Bloggers


    UPDATE, May 20, 2006:
    [P.S. Dear Visualizers, just-in-case you missed the bus, now read the following note posted at their door]:
    Link Leak Blog-to Show Is Open
    ME Strauss wrote this at 11:26 am:

    NOTE: We’ll do this again soon. So leave me comments on how we might do it differrently.
    If you’d like to be part of the next Link Leak Blog-to Show see the last box on this post.

    May 17, 2006

    Every Book Its Reader - Ranganathan's Law Visualized

    Here is a book. It borrows its title from Dr. S R Ranganathan's third (of the Five) Laws of Library Science. The details of the book are:
    Nicholas Basbanes. Every Book Its Reader: The Power of the Printed Word to Stir the World (HarperCollins, 2005). Reviews
    What makes the book interesting for me as a librarian and a student of history?
    Simply stated, it is my curiosity to find out how relevant is my Guru's Five Laws of Library Science and how his mantra is still floating in a world that is now flat (as per the history of the world by Thomas Friedman).
    OK. What are these Five Laws? To read click here
    Going by the title one may ask:

    • Is this book about outsourcing?
    • Is this book about extranets
    • Is this book about offshoring
    • Is this book about open-sourcing?
    • Is this book about In-forming

    Incidentally, such questions are bound to be asked, if one has just finished reading, India versus Indiana: Who is Exploiting Whom? - a chapter from The World Is Flat: A Brief History of the Twenty-first Century by Thomas L. Friedman, Farrar, Straus and Giroux, 2005. see my comments on Friedman's book
    A single answer to the above questions would be, simply said, the book has none of the above.
    A last question one may have, because as a student of Library Science, I succinctly recall that there is one significnat implication of this third law. This implication is all-a-do-about OUTREACH. That is, reach everyone of those who cannot reach the library.
    Then, does this book deal with libary services and innovations in outreach and reaching out?
    The answer, again, is in negative.
    WHEREAS, the book is about how the printed word--or how the love of books--makes history (i.e.,Yesterday, Today, and Tomorrow of the printed books). As a student of library history, I see this book is of great value for the posterity.
    On the Law, per se, I have a word to mention.
    The author writes an interesting note about Ranganathan and his Five Laws:
    In time he wrote fifty monographs in his field, most notably Five Laws of Library Science (1931), which outlined a set of principles that ha become a guiding code among professinals.

    Three of these laws--Books Are For Use, A Reader's Time is Precious, and Libraries are Growing Organisms--were directed primarily at his colleagues. The other two--Every Reader His Book and Every Book Its Reader---have meaning for anyone with an abiding respect for the written word. They also form the guiding premise, and suggested the title, for this book.(p. 15-16)

    Furthermore, regarding the appropriateness of the Third Law for this type of library history (meta book, book about books, and bibliomania), I had my own doubts. And this doubt is clarified, to me, by a close assoicate of Dr. Ranganathan, viz., Prof. A Neelameghan, in the following words:
    In general, the set of Five Laws constitute the guiding principles / the fundamentals of library and information service in the changing info environment. LIS professionals would do well to provide service that complies with these laws.
    End-users (readers) may also use the first three laws to ‘evaluate’ the service they are getting from the library, again in the changing info environment. (personal communication, dated May 16, 2006)

    ‘Every Reader His/Her Book’ can, as I mentioned earlier, viewed from the library professionals point of view and also that of the ‘Reader’. A reader may search first an online catalogue / union catalogue (in a library or from home), then (or straight away) go to the library for his book, or to a book shop, and to a friend’s book collection, etc. depending on when his need gets satisfied. When he visits the library the latter is expected to have organized the collection, etc and provide services that ensure the reader gets his book from its own collection, or through inter-library loan, or reader given advice where and how else he / she may get his / her need satisfied; sometime it may be another book that satisfies his / her need better than the one he / she may be looking for. The interpretation of the Laws can comprehend different viewpoints. (further clarified in a second personal communication, dated 17 May 2006).

    The Bottom Line: Thank you Nick (ie., Prof. Nicholas Basbanes) for this learning opportunity. And Wish You Good Luck to Write More Books. But, do not forget the mantra. I mean, remember there are four more LAWS of my Guru. I wish and pray that God give you a long life to write at least four more books.

    May 16, 2006

    Google Trend - Another Way to Visualize the Blogosphere

    Click here: blogosphere, and you will see the true colors of search results.

    In short, Google has another source of information visualization, viz., Google Trend. You can view graphs and news articles relating to whatever you search and wish to compare search results.
    About Google Trends
    With Google Trends, you can compare the world's interest in your favorite topics. Enter up to five topics and see how often they've been searched for on Google over time. Google Trends also displays how frequently your topics have appeared in Google News stories, and which geographic regions have searched for them most often.

    Examples. yankees, red sox · skiing, surfing · summer camps · earthquake · tax forms, tax extension · hurricane katrina, gas prices ...
    Read all the FAQs

    May 09, 2006

    Blog As A Teaching Tool

    This will be a running post: Updated 2 March 2007


    Blogging for Scholars
    Does your prof blog? If he or she does, you had better know about it. Professors who blog do so for a variety of reasons. Some are musing aloud over new ideas or research that will later appear in scholarly journals and on your library's shelves, virtual or physical. Some are exploring new ways of expression or appealing to a larger audience than they get in the paid lecture hall. Or they may be trying out a side of themselves that they don't quite dare expose fact-to-face with their primary community Continue reading @ Emerald LibraryLink

  • Moving Student Blogging Beyond the Classroom: Another Look, Posted by gsiemens, August 09, 2006
  • Emerging Teaching Tools. Distance Learning, Screen Recording, and Blogging, Ruth Duffy, July 24, 2006
    The theme of this conference -- Unfolding the Future -- is focused on ways to enhance tomorrow's college and workplace environment. In our workshop, we have highlighted three of the emerging technologies -- Blackboard, Camtasia, and Weblogs -- and how they are being used at Shoreline Community College. Now we would like to hear from you...
    If you are uncertain about how to do any of these steps, click here to go back and review. You may also listen by choosing "play this audio post" below. continue reading

  • Amanda @ blogwithoutalibrary.net, cites a new publication: "teaching social software," July 18, 2006, and Amanda states:
    Heads up: if you have any interest at all in teaching social software, you should read Teaching Social Software with Social Software by Ulises Mejias in the current issue of Innovate: Journal of Online Education (free registration required for full-text)...
    As you can imagine, I was thrilled to stumble upon this article (thanks, Paul!), given the fact that I’ll be doing a bit of teaching-social-software-with-social-software myself this Fall. I was even more thrilled to find out that Innovate hosts webcasts with their authors, and Mejias’ webcast happens to be this Thursday at 12pm.

    A Biological Blogger, July 14th, 2006
    Paul Z. Myers, an associate professor of science and math at the University of Minnesota at Morris, is something of an accidental blogger: He only started after setting up a Web site for students enrolled in one of his courses...

    How does a blog on developmental biology become such a big hit? Injecting a bit of politics into the proceedings doesn’t hurt: Mr. Myers, who bills himself on the blog as a “godless liberal,” mixes strongly worded attacks on creationism and intelligent design in with other “random biological ejaculations.” —Brock Read . Continue reading from A Biological Blogger. More of this Genre Webblogged at Blog Juice for Educational Technology

    Not sure, what is this all about?
    Hearing, seeing and listening may change your perception.
    Here you go [just-in-case you want to be oriented towards this subject] with a :

    TITLE: How and In Which Situations Web Logs or Blogs Work: How and Why They are Valuable in Children's Education
    SPEAKER: David Weinberger
    EVENT DATE: 11/15/2004
    RUNNING TIME: 55 minutes. (Thanks to Web Capture @ Library of Congress for sharing this excellent speech)

    I guess I am the ten zillionth person who is trying to visualize the above question. The deep web has this question and stated in umpteen ways. Nevertheless, the most common concerns include, viz.: a) the suitability of this tool to communicate; b) the compatibility of this tool in interactive learning process; and c) find WHAT WORKS, WHAT DOESN'T, WHAT'S PROMISING

    Let us begin with a reflection on the process involved and visualize the whole picture:


    "...These days it is rare to talk about a single function tool. Many discussion board providers now bill themselves as community software providers and bundle other tools into their products such as chat, instant messaging, polls, blogs, wikis, member directories and file sharing. So you will find some overlap between the first few sections of the tour and the groupware section! In addition, there is sometimes a split in communities where some like blogs and wikis and others prefer discussion boards. This split may be generational, but regardless of its origin, it is helpful to be aware of this and figure out how to bridge between the groups when picking tools."[source: Web Based Discussion Tools, in Tool Tour, by Nancy White. See also herein excellent illustrations and examples in "Social Software Tools (Blogs, Wiki's, and Other Creatures)."


    I will summarize my findings. The Webliography at the end of this article will give a link to some significant resources.

    A. Blogsavvy's prescription very valuable (value added because, it has received 53 comments, which would mean some thing that is really worth looking at!)

    How NOT to use blogs in education:
  • Never never approach blogs as discussion boards, listservs or learning management systems
  • Group blogs are a bad idea and don’t work
  • Don’t try and force blogging into something else
  • Ignore RSS at your peril

  • B. Arguments for and against using Blog are equally educating, in the Blog by Anthony Moretti, and I quote:
    Arguments for using Blog as a Tool:
  • Young people are using this technology; they might not read as much as we would like them to, but they do blog (and love pods)!!
  • Can foster creativity and expression; if this gets students to write, think, analyze; why not use it?
  • Cheap; can be set up for no money and be used in a variety of ways
  • Errors, omissions, biases, etc. can be caught
    Arguments against using Blog as a Tool:
  • Small audiences
  • Staying power?
  • Deciphering the junk from the credible

  • C. Despite the above inspiration, the Sixty Four Dollar question remains:
  • Are blogs good for education? Bill Bruck wrote in his blog as early as in December 2004 in Blended Learning:
    Well, they aren't awful. They are fashionable right now, and so may gain learner acceptance. They get learners to write, which is inherently good, and to express their opinions - which may or may not be a good thing. But there's a fundamental problem with blogs: They are essentially optimized for easily publishing one’s opinions on the web. This is fundamentally a flawed model for education. It promotes narcissism, not dialog.

    D. And the wise continue the debate. The latest evidence-based wisdom comes in a podcast, "Blogs in education: podcast," delivered by Keith Burnett’s blog, and posted on April 2nd, 2006
    Educational uses of blogs include: as class diary for a specific group of students, as notice-board for a whole cohort, and even as a space for students to write themselves.
    Students producing their own blogs requires careful thought. Web pages are cached by search engines and can be held in ‘frozen’ form for years – for this reason students might want to post under an assumed name. You also need to check College regulations about external publication by students. Some students find having their own page to show off work a motivational factor. Some teachers use blogs as notice boards for whole cohorts of students. I would suggest switching off the commenting in this case and possibly adding an e-mail list facility so students can have new notices e-mailed to their inbox.
    I find that I have most success with blogs used as class diaries – each class has a page. I can pop a summary of each lesson on the blog, and I can add links to Web pages with exercises, explanations, interactive quizzes or demonstrations. The blog can then be used by students who were at the lesson as a reminder of the main themes (and homework) and as a guide to carefully chosen and relevant Web pages. Students who had to miss all or part of the lesson can find a summary, possibly with text-book readings and some links that will enable the student to get the gist of the lesson and be able to join in a little more next week.

    E. Research Prospects in this Area
  • Blogs help students think for themselves,by Anna Salleh, ABC Science Online, 2 September 2005:
    Blogging is helping students to think and write more critically, says an Australian researcher, and can help draw out people who would otherwise not engage in debate.
    These are the preliminary findings of PhD research by Anne Bartlett-Bragg, a lecturer at the University of Technology, Sydney, who has been using weblogs or blogs in her own teaching since 2001.
    She says blogs are also extremely useful for categorising and managing a large collection of thoughts, whether they are from lecture notes, a student's own ideas, or comments on the ideas of others.

    F. Webliography:
  • Susan Crawford. Blogging on blogging on blogging, 02 Jun 2006
  • Zarah Grace C. Gagatiga. Blogs as Teaching Tools, 1 May 2006 
  • --. Blogging as a Tool for Teaching, March 29, 2006
  • Anthony Moretti. Using Blogs as a Teaching Device, 2 May 2006
  • Minjuan Wang, and Laura Bock, The Use of Blogs in Teaching, Knowledge Management, and Performance Improvement, World Conference on E-Learning in Corporate, Government, Healthcare, and Higher Education (ELEARN) 2005
    Vancouver, Canada October 24, 2005, ELEARN, Volume 2005, Issue 1.
  • Craig W. Smith. Synchronous Discussion in Online Courses: A Pedagogical Strategy for Taming the Chat Beast
  • Teacher dude. blogging and teaching ESF/EF, 3 May 2006
  • GIL KLEIN. iPods, podcasts latest teaching tool in classrooms, May 1, 2006
  • Ben Yates. Wikipedia as a teaching tool, 19 Jul 2005 
  • Learning from blogs, by Anna Davis, at EduBlog Insight [EduBlog is a place to reflect, discuss, and explore possibilities for the use of weblogs in education]
  • A. S. Tolba. The Potential of Blog as a Teaching and Learning Tool, 4 Nov 2005
  • Bryan [ http://killthefattedcalf.blogspot.com/2006/02/academic-blogs.html dead link ], Academic Blogs
  • Ewan McIntosh.Assessment is for Learning - so is blogging
  • What are the pitfalls of using blog as a teaching environment?
  • See also Blogsphere Search results 1 and Blogsphere Search results 2
  • Natasha Spring and William Briggs, Ed.D.The Impact of Blogging: Real or Imagined? [text in pdf]
    Microsoft's technical evangelist Robert Scoble met recently with CW Executive Editor Natasha Spring and frequent CW contributor William Briggs to set the record straight on blogs, their impact on the media, whether companies have anything to fear from this new communication medium, and the release of his new book, Naked Conversations.
  • Dorai’s LearnLog. Effective Bloggers are Learners, Thinkers, Explorers and Dreamers, May 26, 2006
  • Nancy White. Seven Competencies of Online Interaction,from the Northern Voice 2006 Canadian Blogger Conference in Vancouver on 11 February 2006
  • Diane Levin ,Mapping the blogosphere yields information about human behavior for social scientists, June 27, 2006
  • Track A — Blogs, Wikis, and Collaboration Tools, Internet Librarian International 2005, Transcending Boundaries: Information Technologies & Strategies for the 21st Century, 10-11 October 2005 • Copthorne Tara Hotel, London
  • Improving the quality of online presence through interactivity, Information and Management archive, Volume 42 , Issue 1 (December 2004), 217 - 226: 2004
    Online interactivity is becoming a valuable way of improving the communication quality of business web sites. As a result, it is important that web site designers understand the concept and how it affects the quality of web site design. This study empirically validated Ha and James' five interactivity dimensions (playfulness, connectedness, reciprocal communication, information collection, and choice) and their relationship to design quality. Continue Reading Improving the quality
  • Goodbye, Blog: The friend of information but the enemy of thought, by Alan Jacobs
    Whatever one thinks about the structure of the internet as a whole, it is becoming increasingly clear that the particular architecture of the blogosphere is the chief impediment to its becoming a place where new ideas can be deployed, tested, and developed. Take, for instance, the problem of comments. Continue reading Goodbye
  • TLT Group. Exploration Guide: Educational Uses of Blogs, Wikis, RSS Feeds, etc.
  • Using technology in teaching and learning cited by Cindee. [Full citation ]
    Using technology in teaching and learning: Resources to help you navigate a digital world, C&RL News, February 2007, Vol. 68, No. 2, by Bryan Alexander
  • Accuracy and the Blogosphere
  • Wikis, blogs and podcasts: a new generation of Web-based tools for virtual collaborative clinical practice and education, by Maged N Kamel Boulos, Inocencio Maramba, and Steve Wheeler, BMC Med Educ. 2006; 6: 41.
    Published online 2006 August 15. doi: 10.1186/1472-6920-6-41. [full text]


    See also my previous posts:
  • Citing a Blog, Wiki - Style for bibliographic notes and references
  • What's a blog - WYSIWYG
  • Blogging Spree: Trends in Information Visualization
  • Information Visualization at Wikipedia - Blogspheres Perspectives

    Quotable quote from Library Stuff:
    The power, posted December 19, 2003
    Anna writes:
    "There's something seriously wrong with the world when one innovative, blogging, rarin' librarian can have more links in a web directory than one of the most important theorists on classification and indexing."

    That's the power of weblogs, especially in the library world. I'm not sure why this is surprising, however. Who is more likely to have more content on the web, Jessamyn or Ranganathan? You will probably find more information on Ranganathan in books (library science 101, etc), than Jessamyn. Also, as Greg so dutifully points out, most of the links are interviews. When was the last interview you read on Ranganathan?