About this Blogsphere:

This blogsphere attempts to capture, catalog and share resources relating to visual perception of information. It is about a world mostly dealing with Physical (Touch, Taste, See/Sight, Smell and Hear) and sometimes Metaphysical (and that is none-of-the-above category). Physical, for instance, touch (e.g., feel, felt, found), look and visualization, is here with an attempt to combine verbal, vocal and visual--to synchronously see, hear, share and do much more. Interestingly, in order to visualize one does not need special skills, competencies, etc. It is all about common sense, especially with human visualizations. In short, "information is in the eye of the beholder." Continue reading much more all-ado-about this Blogosphere

Akbani is a Cutchi Memon family name.

Showing posts with label Treemap Visualizer. Show all posts

March 14, 2010

SuperPower: Visualising the Internet's The top 100 sites

NB. Info courtesy: Dr. John Jaeger, Dallas Baptist University
Image courtesy: Paul Adams, VizWorld.com

BBC News - The top 100 sites on the internet
Explore this interactive graphic to find out which are the biggest sites on the internet, as measured by the Nielsen company. This feature is part of SuperPower, a season of programmes exploring the power of the internet.

The data used to generate the interactive treemap visualisation was collected by the Nielsen company and covers the UK, France, Germany, Italy, Spain, Switzerland, Brazil, US and Australia. The figures represent unique users for the month of January 2010.

The categories – such as retail, social networks, search/portal – were defined by the BBC. Because some websites have more than one use, they could fall within more than one category (e.g. Yahoo). However, the treemap only classifies them once.

The maps were produced using the Prefuse Flare software, developed by the University of California Berkeley.

October 21, 2008

INTERACTIVE MAP: U.S. Newspapers pick the president

Info courtesy: markstoneman @ Newspaper Endorsements & blog.techfun.org
10000words.net: "The following map is a collective representation of the endorsements made by newspapers across the country for the 2008 presidential candidates. Currently Sen. Barack Obama leads Sen. John McCain in the number of endorsements made by the nation's newspapers as indicated by the blue markers. You can read the actual endorsement from each newspaper by clicking on the corresponding marker:"

http://10000words.net/presidential-endorsement-map.html
See also previous post: Visualizing Election Polls: An Animated, Interactive Way To Analyze Opinion Data

October 15, 2008

Visualizing Election Polls: An Animated, Interactive Way To Analyze Opinion Data

ScienceDaily (Oct. 6, 2008) — "Do you want to know the percentage of white women who support vice presidential candidate Sarah Palin? What about college-educated versus high school-educated white women? Or those who also hunt?"
Continue reading / see alos: 5 Ways To Visualize The U.S. Elections

PS. This post is inspired by a visual: Palin's Debate Technique by deunadiana @ Cosmopolites' Kaffeeklatsch


November 03, 2007

Mapping the Unmappable: Visualization continues to advance

Quotable quote of the year: 16 years ago today the word "Internet" first appeared on af ront page or cover of the major media: Wall Street Journal, Page One, the story about eBooks -- 29 Oct, 2007. Thus said: Michael S. Hart, Founder Project Gutenberg

See in same shelf and aisle:


  • A looming legal crises on the Internet, MICHAEL RIGLER, The Western Star
  • August 25, 2007

    Visual immersion using Web Analytics

    Practical analytics: persuasion scenarios
    @ immeria - An immersion in Web Analytics,
    by S.Hamel
    A typical site is composed of several conversion objectives: registering to a newsletter, purchasing something, finding the nearest store, or any activity that represent a positive outcome for the user and the site owner. As Brian Eisenberg puts it, those represents the "conversion points" of a "persuasion scenario":


    continue reading:

    Practical analytics: persuasion scenarios


    See also my previous posts:
  • Eye to I: Visual Literacy
  • Add Sense to your AdSense: Visualizing the Return on Investment?
  • Look and Feel of Browsers and Websites
  • Concept Mapping Technology - Tool to create HTML pathfinders?
  • Visualizing the Innernet or Visual Display of the Website's Infostructure - AHAREF
  • July 10, 2007

    Browse articles visually with WikiMindMap

    via Lifehacker by Adam Pash on Jul 09, 2007

    Web site WikiMindMap turns complex Wikipedia articles into a visual representations of ideas (i.e., a mind map) to give you an overview of the important concepts and topics related to an idea.

    Browsing a Wikipedia article with WikiMindMap may seem a bit confusing at first, especially if you don't regularly use mind maps, but it offers an interesting way to get a broad understanding of a topic and explore some of the related topics.


    see also:
  • Mind map - Wikipedia, the free encyclopedia
  • Using Mind Maps to Reach Visual Thinkers
  • Mindmapping as a tool for assignments
  • April 27, 2007

    Using Mind Maps to Reach Visual Thinkers


    Posted by gail mcgovern on December 18, 2005 @ clioinstitute blog
    Not only does the article, Seven Steps for Effective Problem Solving in the Workplace, present a clear and concise approach to problem solving, it also includes a link to a companion mind map that makes its concepts more appealing to visual thinkers.

    Think about how you could use this type of technique to engage visual thinkers on your library's website.


    Related posts from my blog:
  • Mindmapping as a tool for assignments
  • FacetMap: A Scalable Search and Browse Visualization
  • Concept Mapping Technology - Tool to create HTML pathfinders?
  • April 09, 2007

    Mindmapping as a tool for assignments


    Bryan is a senior manager who recently qualified as an MBA. During the course, he was given a very tough assignment - to analyze the business opportunities and related ethical considerations arising from cancer in society


    See also:
  • Using Mind Mapping to plan an Assignment
  • Tool Helps Map Out Complex Subjects
  • Google for more and much more

    PS. Thanks to Roy Grubb for the mapping info., and about ways that add fun to the learning process.

    Technorati Tags

  • Mind maps
  • Mindmap
  • Mindmapping
  • Mapping
  • March 12, 2007

    Concept Mapping Technology - Tool to create HTML pathfinders?

    P.S. Thanks to Natalie for this lead. If any one has tried this, please let me know.


    Concept Mapping Technology - Tool to create HTML pathfinders?
    One of the assignments for my Knowledge Management class was a knowledge map. A knowledge map is a tangible representation or catalog of the concepts and relationships of knowledge. A knowledge map is a navigational aid that enables the user to find the desired concept and then retrieve relevant knowledge sources. Read more from Natalie's experiences

    See also
  • Concept Mapping Tool @ Goolge
  • Google for more on "Concept Mapping Technology"
  • Google for: "Concept Mapping Technology" "knowledge management"
  • Visualizing Knowledge @ Google
  • Concept Map pathfinder @ Google

    My previous posts:
  • Visual Search Plus
  • A Visible Pathfinder for Increasing Blog Traffic in 2007
  • Job Pathfinder - Join the race
  • SCAM FREE PATHFINDER in Librarians as Knowledge Managers
  • January 13, 2007

    Information Visualization at Seth's blog


    I noticed two posts that add value to this blog

  • Turning your idea into a picture
    David at Boingboing points us to: A Periodic Table of Visualization Methods.
    I love the spectacular use of technology on this web page. I hate the twisted use of the periodic table (because the relationships between the types isn't natural or elegant the way chemicals are) but it's worth it, because it will certainly inspire you to figure out how to get out of your text rut.

  • Two kinds of people in the world...


    NB. As a bonus to this visualization (not from Seth's Blog), see also: Writing Style, By Gender posted at Jerry’s Blog–Because Wit Happens

    Here’s an interesting site where you can paste in some text and, based on a mathematical algorithm (there’s a link to the scientific paper), the text is analyzed and can generally make a pretty accurate determination as to whether the text was written by a man or a woman. (Be sure and scroll down after you’ve tried this to see which words you’ve used are considered “male” and “female”).

    Technorati tags: Sethgodin

    [image courtesy: Idle Advice]
  • December 09, 2006

    A visual Newsmap

    From News clips, and News in Photos (all static and consuming), and then News in Pictures, and to a far more interactive, dynamic, Web-based streaming and information visualization, is a long trip. But that trip is now over.

    Visual Newsmap has all in one click, and its your click
    concept

    Newsmap is an application that visually reflects the constantly changing landscape of the Google News news aggregator. A treemap visualization algorithm helps display the enormous amount of information gathered by the aggregator. Treemaps are traditionally space-constrained visualizations of information. Newsmap's objective takes that goal a step further and provides a tool to divide information into quickly recognizable bands which, when presented together, reveal underlying patterns in news reporting across cultures and within news segments in constant change around the globe. Continue reading or LAUNCH

    July 16, 2006

    Visualizing Traffic At My Blog Via Mapping The Pathways

    A running post, last updated Feb 3, 2007.

    This is a sequel to my previous post: Visualizing Comments on Blogs

    I am given to understand that 'high blog traffic flows in' if we are writing about Bill Gates, Deepak Chopra, Pat Robertson, (or "Even something inane and mundane gets to be a hit at times"). Read more on this minsdet in my above mentioned blog post

    Today, I found another site that instructs on this very subject, but in a different way:

    Blogs need SEO too, by Neil Patel, July 05, 2006

    Here are the most common mistakes that I see on blogs:

    1. Most blogs do not have meta description tags. You can find a plugin for your blogging platform that will easily add it to each post. You can setup the meta description tag to automatically pull the first sentence from your blog post.

    2. The URL strings on many blogs are dynamic instead of static. You do not want extraneous characters in your blog.
    http://www.pronetadvertising.com/looking%20forward?to@!the231lit.html
    You want clean URLs like this
    http://www.pronetadvertising.com/articles/looking-forward-to-the-little-man.html

    3. Most blogs state their name in the title tag and then the title of the post.
    PaulStamatiou.com - Search Engine Optimization 101
    The two should be reversed.
    Search Engine Optimization 101 - PaulStamatiou.com. Continue reading from Blogs need SEO too


    Measure Map Feeds - and a new Widget
    Looking for better representation sources, I found this write up on widget. And, I signed up for Google's venture: Measure Map. But, I don't have access to it, as of now. I believe it helps in visualizing the blog traffic, graphically. If you know of any similar tool (other than Google Analytics) please let me know.

    See also:
  • blog-a-nomics, Gale Martin
  • 16 Ways to Drive Traffic to Your Blog
  • Google: traffic, blog
  • Technocrati Tags: blog traffic
  • del.icio.us Tags: blog traffic
  • Weblogology: The Study of Blogs
  • More on Weblog theory

    Punch Line:
    Two views about the repeat visitors
    Repeat visitors are not a good measurement either - I used to visit Toronto.com a lot, but only because they were really the only game in town. Did I like their site? Not really ... but I kept coming back out of necessity. Continue reading: AJAX Feedback Mechanism

    I looked at your traffic stats. What do they tell you? How do you interpret the fact that you get almost NO repeat visitors? Study some A List, high traffic blogs in your field or just in general. What are they doing that you might consider doing? Continue reading

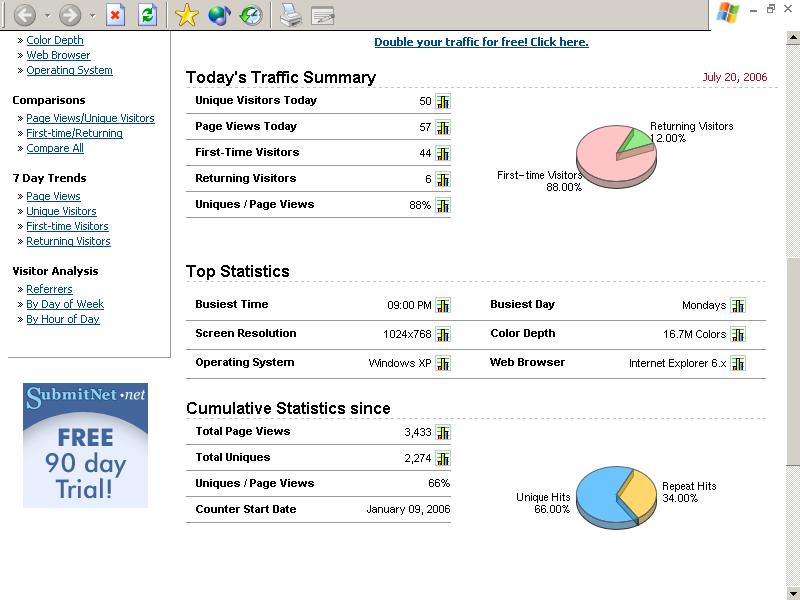
    With malice towards none: My repeat visitors in one day (i.e., today) is 12%; and since birth of this blog, repeat visits are 34% on the whole.

    Now, do you have any comments on the above two observations and this real-time picture of my blog's traffic, as seen below:


    See my previous posts:
  • Blog As A Teaching Tool
  • July 05, 2006

    Visualizing Comments on Blogs

    This is a running post: Updated 10 Feb, 2008:


  • Probing the Nature of Blog Communities
  • 5 ways to get more comments and make you smile February 24, 2006 @ Blog About Your Blog
  • Of comments and commentators @ Sayesha's world
    [see: The casual reader, The friend, The banterer, The loyalist, The silent reader, The 'almost there.' The judge, The mistake finder, The 'I've given up' blogger--Which one are you?]

  • Review: Naked Conversations, the stark naked truth about blogs, Information World Review
    A readable book that converts you to the power of blogging
  • Visualizing Web conversations using Talk Digger, by Frédérick Giasson, August 3rd, 2006
    In only 30 minutes of conversation browsing, I noticed 7 interesting use cases (patterns) in the system. I will present all of them by describing what is happening with each of them.

    coComment keeps track of all the online conversations you're following in one convenient place, and informs you whenever something is added to a conversation. [Thanks Sukhdev for this lead]

    Guardian has an interesting article on how the internet content generation has shifted from 80-20 principle (i.e. 80% of the internet content is generated by 20% of users) to 1-10-89 principle!
    i..e one user creates the content, 10 will "interact" with it (commenting/offering improvements) and the other 89 will just view it! Continue reading Thanks Ashish for this update!

    Here is a summary of how my concern to get a comment has been visualized by bloggers:
    1. Reciprocal Commenting is rare, but mandatory!
    2. You respond quickly and kindly to comments!
    3. ... when a complaint is made against blogging ... well then Hare Krishna! .. respond to it, and improve the situation for everyone...!
    4. One doesn't elicit blog comments by seeking them.

    And my 2 cent's worth responses:
    1. Thank you: I learnt what is mandatory, optional and click for 'next blog'.
    2. That is your speed to check your traffic. Godspeed you have, I mean.
    3. Hare Krishna... is this a Mantra for Bloggers to initiate communication
    4. I thought the basic lesson in life is seeking: Seek and You Shall Find; Ask and You Shall Receive. If you hadn't sent me an email on this wisdom, I couldn't have visualized your mind. Are you a Charismatic guru with 3D transparency (as an open source) to enable viewing mind waves!!!
    And don't have to say any more. The following comment about a comment says more than enough:

    Some people are like potatoes
    There are those who are content to watch while others work they are Spec Tators. Some never help, but are gifted at finding fault and tell others how to do it they are called Comment Tators. Source: www.enidnews.com, cited in

    Today's rant (a comment I just found):
    Interesting post, .... I had something interesting to say, but it took me so long to register for TypeKey I forgot what it was. {and now that blog post in only in google's Cache}

    From a Survey on blog comments:

    After reading the whole survey — or my selected excerpts — a question remains: are comments a good indicator of the success of a blog? As they remain invisible for the most part — you have to visit a blog and voluntarily click the “Comments” link of a post to read them — it seems that comments are only important to the blog owner and to the commentators themselves. Continue reading the survey @ Blogs for Companies, by Roland Piquepaille, April 10, 2006

    Why I don't get comments on my blog? Asked a friend of mine? His blog has a few multilingual and multi-disciplinary posts.

    I told him to read the following two comments from experienced bloggers:

    First, from Andrews's excellent post on infrastructure (including essence, nature, style, design, etc), presence or absence of comments. He has a detailed note on what makes presence of comments a value-added factor in blogs. I like the closing words in his post:
    May be you have a comment on Jacobs' comments about comments. If so, leave a comment in my comments, and I'll try to comment on your comments.
    Second, from G V Krishnan (a.k.a GVK), a well-wisher of mine, who responded to my complaint, among others, on two areas: a) why bloggers are so casual about commenting or responding to comments; and b) why no traffic at my blog. I really enjoyed reading his post. One needs time to read this eleven paragraph classic lesson in blogging .... [pl. ignore his golden rule, mentioned in this sermon: "A blog reader's attention span doesn't exceed three paragraphs."] Below is an extract from his post:
    Dr. Taher's latest lament is that no one takes note of his blog, self-billed as the world's first website to spread the 'multifaith' message. He had sent out a press announcement about his blog to some 300 plus print and online news sources, including western TV channels. None of them appeared interested in Dr. Taher's recipe for inter-faith tolerance, religious harmony and sustainable global peace...

    Dr Taher would have had better showing in the media, if only he had taken to blogging Britney Spears or the Brangelina baby birth in Namibia, Multi-faith wouldn't have a chance. What does Dr. Taher think he is? Dr Deepak Chopra? Or Pat Robertson? But then blogging empowers each one of us with a computer keyboard and Internet connection to reorder the world....

    To get noticed you need to blog something that interests other bloggers. Even something inane and mundane gets to be a hit at times. Blogger Glacier who commutes to San Francisco blogs his observations during his daily train trip in BART (Bay Area, Calif., rapid transit that covers four counties and carries 320,000 passengers) in Bartrage.com. It is accessed by over 25,000 readers a month...

    Dr Taher is a well-meaning guy with a mission. But then good intentions and lofty ideals count for nothing in the mad, mindless world of blogging. At a recent convention of bloggers held in casino capital Los Vegas they came to a consensus on ground rules for blogging. What is acceptable in blogging is polemics, provocative thoughts, bragging, and grandstanding. Plagiarism is okay. Haven't we heard pundits saying, blogging is like golf? You can cheat, but you need to be polite about it. Continue reading Dateline Mysore: Bloggers Don't Drip Like Leaky Tap by G V Krishnan
    These two citations apart, I continued my search for a better understanding if it is all ado about sense making or total nonsense. Luckily, I found two blog mindmaps. Both use creative visualization skills to show how Bloggers converse. The title of the first post is Weblog Conversations. This post is cited by at least three other blogs, but received a single comment. (Another blogger re-worded this title and called it, Visualizing Blog Conversation). The second minmap is a slightly different type, by Nakajima. Nevertheless, for all those who are interested in information visualization (including areas such as, data mining, conversation behavior and communication patterns) of blog comments the above two are excellent mindmaps. These two graphical images can be viewed in a comparative perspective at Data Mining Blog. No comments at this Data Mining post, please note.


    My research also found the following:
    One blog started a year ago, Comments Blog, and wanted to know expectations of bloggers who read his posts. This poor blog has received no comments, whatsoever.

    Some Other Comment Blogs:
  • Blog Comments Revisited
  • on blog comments
  • How to Pay for Blog Comments
  • Blog comments and SEO
  • Seth Godin on blog comments
  • Blogalysis=Blog+Analysis
  • State of the Blogosphere, April 2006 Part 2: On Language and Tagging
    Posted by Dave Sifry on May 01, 2006
  • More On Sense making
  • Some continue asking the same question: Why No Comments

    P.S. Whatever is the debate, libraries are now cataloging comments. One of these citations seems to be a good model, viz., Public Commenting on Organizational Blogs or Websites. Albeit, posted almost a month ago, it has no comments!!!
  • June 13, 2006

    Visualizing the Innernet or Visual Display of the Website's Infostructure

    Show, don't tell, is the bottom line here.
    Websites have their own faces, features, facets, and factbites. Many are however not visualized. Interestingly, businesses and communication portals are now looking (not just at the surface and beyond), even at the inner self. This soul searching is good and hope it lasts longer. By the way, I am not alone in inviting attention to the Innernet (no spelling error) in a material world***
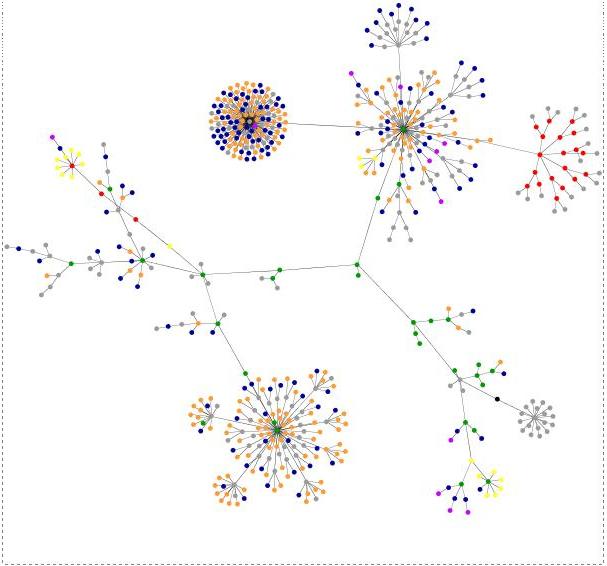
    What follows is a visual of my two blogs' (or Website's) infostructure (not infrastructure, for a difference click here). Click at any of the images, given below and you can visualize the true colors of the content.


    Image on the right: Multifaith Hall of Fame of the 21st century
    Image on the left: Blog As A Teaching Tool
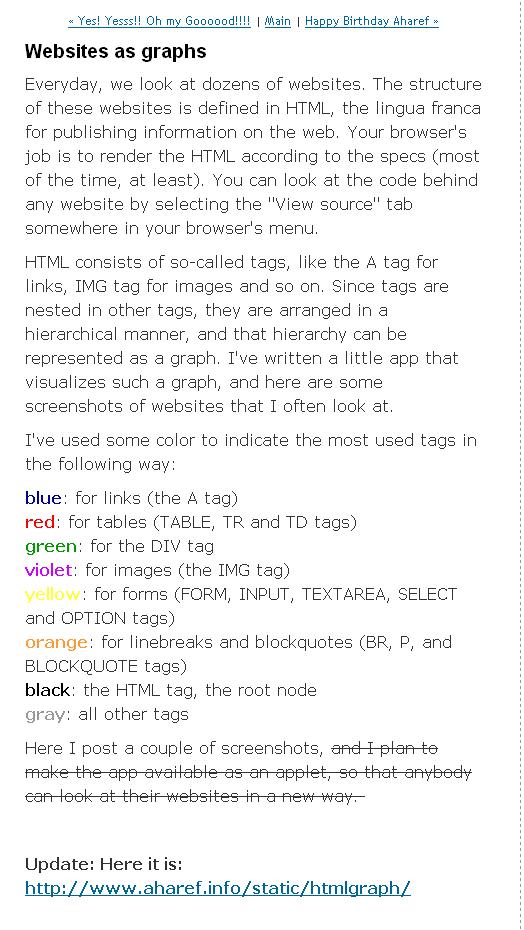
    The meaning of the colors in the above images is well stated by the author of aharef. See the following:
    Acknowledgement: Thanks to Teblog of David Tebbutt for the information visualization tool, viz., Aharef's website-mapper.
    I am amzaed by the way Ted has visualized this graphics: Website Structure (beautifully) Revealed [details]. His tell tale is:
    As a way of highlighting areas for improvement, this is brilliant. It is also quite hypnotic to watch the image evolve.

    Ted has identified another source: Aharef’s Wikipedia site-map. Click and Visualize

    Incidentally, he was inspired by a master visualizer, Guillaume du Gardier. I envy Guillaume du Gardier for his PR and Communication skills. His blog is loaded (I mean it in a positive sense) with all types of graphics, images, and visuals [view here].

    A word about other graphics and applications that pre-date Aharef's website-mapper.
    Knowledge managers have been adopting this sense-making approach in their own ways. See Lennart Björneborn's doctoal work,
    The Corona model with examples of link paths and reachability structures between different graph components in a web space (modified after the Bow-Tie model by Broder et al. 2000) [Details]
    ~~~~Links are for use – the very essence of hypertext;
    ~~~~Every surfer his or her link – the rich diversity of links across topics and genres;
    ~~~~Every link its surfer – ditto;
    ~~~~Save the time of the surfer – visualizing web clusters and small-world shortcuts;
    ~~~~The Web is a growing organism
    quoted in PhD dissertation in webometrics:
    Small-World Link Structures across an Academic Web Space - a Library and Information Science Approach.

    P.S. "I didn't say a word. They did." Thus Spake Feroze Thank you Mr. Feroze for giving me this message in seven short words (amidst your thousand worded blog). You are a creative visualizer (see his blog: my1000words). Thank you also for letting me learn that visuals speak on their own (we don't need to always use a 1000 words).
    ----
    Similar Resources:
    *** There are many more in this stream to give you such an insight:
  • Cover story of the May / June 2006 AIIM E-Doc Magazine, has a lead article on Be Serene: Channel you inner records manager, detials
  • Centre for Spirituality at Work "Fostering good karma a touchy subject; Spirituality is the 'last frontier' of workplace enightenment, but Wallace Immen finds interest in exploding, May 24, 2006 [You may find these articles of interest: An article from the www.Spirituality.com website about our Founding Director, Sherry Connolly, MBA, MDiv, DMin (cand.)]
  • Putting Reflection into Gear, BY : John Baldoni, [ON LEADERSHIP COMMUNICATION] 06/28/2006
  • Vertical and tacit: Multifaith and Knowledge Management in Perspective, details
  • Labyrinths, Sacred Geometry, Innernet & Visualization, details
  • See also: Richmond, Lewis. Work as a spiritual practice : a practical Buddhist approach to inner growth and satisfaction on the job (Broadway Books, c1999)
  • January 20, 2006

    The Hajj Stampede in Graphics - Visualization of the pathway

    Did you know about the following: Hajj, Mina, Jamarat Bridge's Tragedy - 2006?
    The stoning ritual at Mina, outside Mecca, is one of the most dangerous aspects of the annual Hajj pilgrimage. Thursday’s stampede, in which atleast 262 people died, happened on the entrance ramp to the Jamarat Bridge as pilgrims thronged to cast stones at three pillars representing the devil. more... Alternative source: BBC's In graphics: Hajj stampede

    From Other Blogspheres:
    ...Jamarah Plans
    ...Hajj tragedy: Eyewitness accounts
    ...HAVE YOUR SAY Are you affected?
    See Also:
    >>Visualization/Imagination And Islam
    >>Almusawwir:
    Huwa Allah, Creator, Originater, Shaper (Al Musawwir), To Hu belong The Most Beautiful Names (Quran 59.24).
    A wonderful tradition of Islam are the 99 beautiful names of God, or the Asma Al Husna
    Al Musawwir, being one of the names.
    A possible interpertation of this name is The Bestower of Beautiful Forms.
    Sheikh Ibn al-Arabi says: "Know that the divine beauty through which God is named "Beautiful," and by which he described Himself in His messenger's words, "He loves beauty," is in all things. There is nothing but beauty, for God created the cosmos only in His form, and He is beautiful. Hence all cosmos is beautiful." ... A sound report has come in the Sahih of Muslim from God's Messenger that he said "God is beautiful, and He loves beauty." He is the artisan of the cosmos, and He gave it existence in His form. (The Self Disclosure of God - William Chittick - pp. 28, 29). continued