About this Blogsphere:

This blogsphere attempts to capture, catalog and share resources relating to visual perception of information. It is about a world mostly dealing with Physical (Touch, Taste, See/Sight, Smell and Hear) and sometimes Metaphysical (and that is none-of-the-above category). Physical, for instance, touch (e.g., feel, felt, found), look and visualization, is here with an attempt to combine verbal, vocal and visual--to synchronously see, hear, share and do much more. Interestingly, in order to visualize one does not need special skills, competencies, etc. It is all about common sense, especially with human visualizations. In short, "information is in the eye of the beholder." Continue reading much more all-ado-about this Blogosphere

Akbani is a Cutchi Memon family name.

August 17, 2014

Mapping the intellectual structure in the area of humanities: Visualizing citation networks


  • Matteo Romanello (German Archaeological Institut): Exploring citation networks to study intertextuality in classics. Filmed at the University at Buffalo, SUNY.

    Jill Walker Rettberg’s Visualizing Networks of Electronic Literature maps the fragmentary and dynamic field of electronic literature by analyzing citations in 44 doctoral dissertations published between 2002 and 2013. Applying “distant reading” strategies to the ELMCIP Knowledge Base, Rettberg identifies key works in the field, shifting genres, and changing approaches to scholarship.


  • Visualising Networks of Electronic Literature: Dissertations and the Creative Works They Cite, by Jill Walker Rettberg
  •  A Co-Citation Network for Philosophy
  • EXTREMELY VISIBLE AND INCREDIBLY CLOSE READING OF LOGOS
  • Literary DNA and Google Books
  • Networking the Belfast Group through the Automated Semantic Enhancement of Existing Digital Content
  • The Trouble with Tagging
  • VIEW DHQ: VISUALIZING DATA FROM DIGITAL HUMANITIES QUARTERLY (PART I OF II) 
  •  Hacking Networks in the Humanities
  • June 08, 2014

    A Creative Visual Formula to Know Readability in 'My Library' @ CARTOONS BY TOM GAULD

    1770461043 You're All Just Jealous of My Jetpack: Cartoons
    By Tom Gauld -- Tom Gauld lives in London. His comics frequently appear in The Guardian, The New York Times, and The Believer. He has designed a number of book covers. 

    Which color dominates in your library? (cartoon)


    My book of cartoons ‘You’re All Just Jealous of my Jetpack’ is available now:US: http://www.amazon.com/dp/1770461043UK: http://www.amazon.co.uk/dp/1770461043Other stockists and info at www.tomgauld.com
    what’s the difference between “intending to read” and “saving for when I have more time”? or between “pretend I’ve read” and “purely for show”  Source:  book of cartoons ‘You’re All Just Jealous of my Jetpack  
    Review: ""Tom Gauld is pretty brilliant. You’re All Just Jealous of My Jetpack.. is ... dark and funny. Some of the best comics in the collection are the bookish ones, taking chummy digs at everyone from Martin Amis to the Brontës to “proper literature.” —Flavorwire 
    -- (see also notes)
    On the same shelf:
    •  What kind of library user are you (Quiz)?  Are you a “Library Lover”? An “Information Omnivore”? Or are you totally “Off the Grid”? Take our library engagement quiz to learn how your library habits and attitudes stack up against the general population.
    • BOOKS BEAT SUMMER SLIDECheck out our latest infographic to see just how much kids' reading skills improve when they have access to books over the summer.Photo: BOOKS BEAT SUMMER SLIDE! 

Check out our latest infographic to see just how much kids' reading skills improve when they have access to books over the summer.

http://blog.firstbook.org/2014/06/03/books-beat-summer-slide/

    May 22, 2014

    The Life Cycle of Ideas -- Visualizing Citations


    Note: * * * Here is an article using the techniques of citation analysis. By implication, is very similar to  a visualization of Dr. SR Ranganathan's idea plane!!!.Here is one sample of citation analysis, visualized as Dr. SR Ranganathan's idea plane!!! (more this here). Co-incidentally,  Ranganathan's colleague, Dr G. Bhattacharya (@ DRTC), developed the idea of popsi (Postulate-based Permuted Subject Indexing), and the following image and article appear in a journal Popular Science, whose acronym is popsci.***

    'How scientific concepts rise and fall,' By Katie Peek
    -- image courtesy: popsci.com

    • Life sciences tend to have a flatter citations trend [shaded portion], perhaps because ideas in the field are easier for other experts to grasp—in contrast to fields like mathematics—so it takes less time for them to catch on.
    • Among the authors who wrote multiple top papers [arcs that link dots] are five Nobel laureates. John Pople, a theoretical chemist who won in 1998, appears twice in multidisciplinary chemistry and three times in physical chemistry. 
    • Large numbers of authors [dots] tend to appear on more recent papers, as in environmental science. Ambitious experiments today can require hundreds of scientists, and in some fields big collaborations can lead to very long author lists. 
    • The most-cited papers [black music notes]have longer lifetimes than others [shaded portions]. Some are methods papers, which lay out experimental techniques other scientists use. Others articulate important theories, cited for decades.
     On the same shelf:
    •  Everything is Editorial: Why Algorithms are Hand-Made, Human, and Not Just for Search Anymore by Aaron Kirschenfeld

    May 19, 2014

    Comparing Indian states and territories with countries --The Economist Visual Map

    Comparing Indian states and territories with countries An Indian summary Which countries match the GDP and population of India's states and territories? How big is Uttar Pradesh, India's most populous state? One way of answering the question is to take its total area: 95,000 square miles (246,000 sq km). Another way is to think of it as a country. If Uttar Pradesh were to declare independence, it would be the world's fifth most populous country (as the map below shows, it has about the same number of residents as Brazil). Yet its economy would only be the size of Qatar, a tiny oil-rich state of fewer than 2m people. That makes it poor on a per person basis. Despite India's two decades of rapid growth, Uttar Pradesh's GDP per head is close to that of Kenya. The map below presents country equivalents for India's states and territories in terms of GDP, GDP per person (in PPP terms) and population. Please play around with it and tell us what you think.
    PS. Click on the image to go to the dynamic visual map @  The Economist

    May 17, 2014

    India Elections 2014 : Search Engine Infographics

    What's new for 2014:
    Search Engines:
    Google:


    bing:


    Yahoo

    On the same shelf:

    May 06, 2014

    Data visualization of the actual rap vocabulary used by Matt Daniels

    Mapping the Largest Hip-Hop Vocabularies of Rappers, by 

    New York-based designer Matt Daniels crunched the numbers on a list of 85 rappers to find which emcee has the largest vocabulary in hip-hop. The dataset was culled from the first 35,000 lyrics of each musician’s catalog taken from the website Rap Genius, so as to the level the playing field between newer and older artists, a number that comes out to around three to five albums worth of music. For context, Daniels also included the famously verbose Moby-Dick and the works ofShakespeare as benchmarks.   continue reading

    May 05, 2014

    Map of World's Evolutionary Tree of Myth and Religion ... by Simon E Davies, The Human Odyssey

    Note about this Infographic: * "A wonderful Map of World Mythology from Simon. There are still some corrections to be made and will be brought out in the next version." Mythology *


    * The best way to view this graphic is by clicking on the picture and then selecting the ‘Full Screen’ option at the top right hand corner of the image *

    Since the dawn of mankind, humans have tried to make sense of their world, especially when faced with unknown phenomena such as 'what causes storms', 'what happens to us after we die', and 'why to the planets move through the night sky'?

    As homo-sapiens developed the ability for cognitive thought, so too did the first signs of religion seem to arise. The earliest evidence of a religious practice can be traced back 300,000 years ago when we began to bury our dead. Although we cannot define this as the origin of faith, it does suggest that at the dawn of humanity, we had begun to consider some kind of afterlife.

    Over time, this religious practice gave rise to a new ideology which spread across the continents, known today as ‘Animism’. This emerging faith was the root belief system that would evolve and branch out into numerous other ideologies all over the world. The journey of these evolving religions can be broken down into five core stages:

    • Stage 1: Animism (100,000 BCE – Present)

    Humans began to believe that natural constructs (e.g. plants, animals, rocks and wind) possessed a spiritual essence. These spirit entities were believed to have powers and temperaments that influenced our everyday world. By worshiping these divine beings, it was believed we could maintain harmony with this spirit world and gain favors from them.

    • Stage 2: Polytheism (5,500 BCE – Present)

    The roots of Polytheism seem to lie in the Proto-Indo-European traditions. It seems likely the generation of new Gods were adopted from the nature spirits of the old world (giving abstract beings of thunder and Earth a more human form). During the Neolithic revolution, civilisations began to emerge requiring new areas of expertise (e.g. lawmaking, metallurgy, agriculture and commerce). It was the Indo-European Gods who took on the role of guide and leader to the civilised world.

    Typically these divine beings were divided into several classes, overseeing the heavens, the mortal realm and the underworld. Each deity possessed their own powers, religious practice and domain (e.g. trading, diplomacy, warcraft etc). Man could either worship one or all of these beings, gaining favor from them via offerings, prayer and even sacrifice.

    • Stage 3: Monotheism (1348 BCE – Present)

    In the Bronze Age, a new movement took shape that prioritised one God over all other deities. This system is known as Monotheism - a belief in one supreme being. In 1348 BCE, the pharaoh Akhenaten, raised a lesser known God called 'Aten' to supreme status, downplaying the role of all other Egyptian deities. A little later in Iran, Zoroaster (a Persian priest) claimed 'Ahura Mazda' to be the one supreme deity. This newly emerging system posited that one creator god had formed the known universe, and was totally self-sufficient, capable of ruling over all other domains. This idea became prominent in Judaism, Christianity, Islam, and Sikhism.

    Most monotheistic systems tend to be exclusive in nature, which meant the gods of the Old world had to be purged from mans consciousness. As a consequence, monotheistic religions displayed less religious tolerance than polytheistic religions, resulting in many wars and political disputes.

    • Stage 4: Philosophy (585 BCE – Present)

    During the Iron Age, many scholars began to question the faith systems of their day. Rather than accepting a religious view as the definitive answer to reality, they began to question the nature of the divine. These probing minds inspired a philosophical movement that swept throughout the old world (often ascribed to the Greek thinker Pythagoras). Great thinkers like Lao Tzu, Epicurus, Confucius and Hypatia were in pursuit of the ultimate, spiritual truth which included a desire to understand the laws behind reality.

    What set these philosophers apart from other religious systems was the fact that they emphasised the use of reason and critical thinking over faith. In philosophy, something is considered true only if it is completely proven true on a long term basis by means of reasoning. If not, then it can not be considered the ultimate truth.

    However, the Biblical worldview held sway for over a thousand years, ridiculing many philosophical truths as bordering upon blasphemy. Copernicus and Galileo the two foremost casualties of theological interference, with Galileo placed under house arrest by the notorious Inquisition. But all this was soon to change.

    • Stage 5: Scientific Revolution (1600 CE – Present)

    Over many centuries, philosophical questioning and testing gave rise to a new movement - known as the scientific revolution. A school of scientists believed that reality should be allowed to speak for itself, removing the subjectivity of human imagination and superstition.

    The basic procedure of the scientific method was to explain a phenomenon using a hypotheses, and then designing a series of experiments to test this hypotheses. By repeating these tests, the validity of this theory would be revealed (determining it as either fact or fallacy). Such tests have given humanity an objective and profound insight into the workings of the universe.

    This radical ideology quickly spread across Europe and the America's, introducing new perspectives on the natural world and man's place in it. The scientific revolution challenged ideas grounded in tradition and faith, promoting healthy skepticism and reasoning.

    It opposed superstition and religious intolerance, making a long-term impact on the culture, politics, and governments of the Western world. It is considered the best method for making useful and practical additions to human knowledge about the physical world, and has resulted in the technological leaps made since it developed in the 1600's. This includes:

    * Copernicus updating of the heliocentric model by replacing the Earth with the sun as center of the known universe.

    * Isaac Newton's law of gravity which explained the elliptical orbits of the planets.

    * Charles Darwin's theory of evolution by natural selection, which explained that all living things in the world evolved from a common ancestor in the distant past.

    A Very Rare Book Opens 6 Different Ways, Reveals 6 Different Books


    Info courtesy: BENJAMIN STARR

    A Very Rare Book Opens 6 Different Ways, Reveals 6 Different Books


    "Book binding has seen many variations, from the iconic Penguin paperbacks to highly unusual examples like this from late 16th century Germany. It’s a variation on the dos-à-dos binding format (from the French meaning “back-to-back”). Here however, the book opens six different directions, each way revealing a different book. It seems that everyone has a tablet or a Kindle tucked away in their bag (even my 90 year old grandma), and so it sometimes comes as a surprise to remember the craftsmanship that once went along with reading. Continue reading visualnews.com

    March 26, 2014

    How big companies use colours to affect your emotions


    Does McDonalds make you feel 'joyful'? Infographic reveals the psychology of colour and how it's used in advertising, Daily Mail, ByVictoria Woollaston


  • Psychologists recently found logos are hardwired into our brains
  • We identify logos from the age of two, and link products in 67% of cases
  • Researchers from Chicago used colour psychology to study popular logos
  • It found Google's green Android is associated with peace and hope
  • McDonald's' yellow arches were found to instill feelings of joy and energy
  • While the orange used by Fanta is synonymous with creativity
  • THE PSYCHOLOGY OF COLOR @ elvingarcia.com

    Red: Associated with intensity, passion and aggressiveness.
    Examples: YouTube and Red Bull
    Blue: Associated with trust, confidence, and ‘depth and stability of the sky and sea’
    Examples: Samsung and Ford
    Yellow: Associated with joy and energy.
    Examples: Ferrari and McDonalds
    Green: Associated with the ‘harmony of nature’, relaxation and hope.
    Examples: Android and Starbucks
    Purple: The colour purple is linked to the ‘luxury of royalty’.
    Example: by Cadbury, FedEx and Yahoo.
    Orange: Associated with feelings of enthusiasm and creativity.
    Examples: Mozilla’s Firefox and Fanta.
    Pink: Associated with feminine traits, warmth, love and nurturing.
    Examples: Barbie, LG
    Black: Bold, luxurious and associated with the ‘formality and mystery of the night’.
    Examples: BlackBerry and Tiffany and Co.
    Brown: Dependable and reliable.
    Example: UPS and M&Ms
    Text below and Infographic by Financesonline.com @
    Companies like Pepsi spend millions of dollars on their logos, but some iconic logos like Google and Coca-Cola didn’t cost a single penny and they have remained almost unchanged since they were originally designed. This may well be due to their clever use of colors and the psychology of emotions behind them. On the other hand, having an elite logo is well worth the cost. Some logos, like Apple or Nike, are so powerful they don’t even need word-marks to be recognizable. In fact, psychologists proved that famous logos are so wired into our brains, that at the age of 2 kids can already link a product with its logo in 67% of cases.  
    logo designing review

    March 14, 2014

    "The Truth" | Official Kia K900 : A great example of visual storytelling


    Watch the Video: "The Truth" | Official Kia K900 Morpheus Big Game Commercial 2014

    Note: Kia has not released much information on the 2015 K900 other than the preview image. automobilemag.com

    Voice populi (reviews):
    'I am seriously disappointed in the "Morpheus" character advertisement for the new Kia automobile.
    Yes, I get it. Movies are ultimately commercial enterprises.
    But I really do hold a special place in my heart for the first (and only the first) Matrix film as an incredibly powerful modern myth. Selling out like this, well, it just hurts.'     
    NYTimes: "But why would anyone want a luxury sedan that looks so much like cars that cost one-half or one-third as much?" - $66,400 Answer, but What’s the Question?
    On the same shelf: 
    • Visual Storytelling: How to Use Visuals, Videos and Social Media to Market Your Business
    • Different ways of knowing : Daniel Tammet has linguistic, numerical and visual synesthesia — meaning that his perception of words, numbers and colors are woven together into a new way of perceiving and understanding the world. The author of "Born on a Blue Day," Tammet shares his art and his passion for languages in this glimpse into his beautiful mind. 
    • Study: We’re all prone to “bias blindness”

    March 09, 2014

    Words As Visuals: A Woman’s Body

    “If a woman is free to show her body, why should she not be free to cover it?” - See more at: Acknowledge Class Warfare Exists


     On the same shelf:

    March 03, 2014

    Nine Lives of the Library Catalog

    STUDY: Cats Not As Effective As Index Cards At Organizing Books, Fluffington Post (image courtesy: Fluffington Post)
    "A new study from the Dewey Institute finds that while cats are far more adorable than index cards, they aren’t as effective at organizing books.  While this new study will undoubtedly save some libraries the mistake of investing in all-cat system, the American Library Association tells The Fluffington Post that as many of 175 libraries across the country have collectively already spent over $20 million on these ineffective organizational catalogs."

    This significant library product (output format), traditionally called a book catalog (and now OPAC), has at least nine funcitonal names, as used in the library world (with spelling variants in British, American usage). According to Robert Lopresti, the catalog keeps changing. These nine lives, not a final list, are depicted in the following funcational names of this product
    1. Library catalog (aka Library Catalogue), 
    2. Card catalog  (aka card Catalogue =  is an individual record in a library catalog), 
    3. Library index (as in a database),  
    4. Shelf List (esp., for inventory),
    5. Classified catalog (aka subject catalog, Systematic catalog),
    6. Dictionary catalog (aka  Keyword catalog),
    7. Author catalog
    8. Title catalog
    9. Online catalog (OPAC) 
    Further, this library product must have lived nine lives, from its inception (in pre-print age, with the Arab bibliographer compiling the first library catalog in the Arab World: Abu'l-Faraj Muhammad bin Is'hāq al-Nadim (Arabic: ابوالفرج محمد بن إسحاق النديم‎) (died September 17, 995 or 998) was a Muslim scholar and bibliographer), thence to the card format, microfilm format, microfische  format, etc., to the present OPAC (Web-based Online Public Access Catalog). 

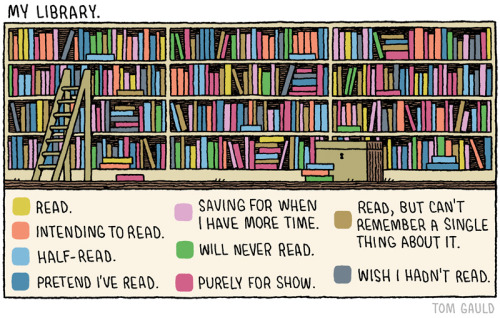
    The following image taken from article Nine lives of the catalogby Robert Lopresti, has one more way to look at the true colours of the nine lives:


    What are our Tools ? (for input, these are also nine depending on the expression, manifestation, item type, access options, etc.)
    "AACR / RDA = content standard for resource description and access MARC / MODS / FISO= communication and exchange format providing a structure for encoding the content of bibliographic and authority data Related to: ISBD = rules that organise the display of a bibliographic description of an item in a catalogue FRBR = a entity-relational model of the data required to find, identify, select and obtain resources"
    LC or Dewey Classification number's; LC/ Sears / MLA's Subject Headings; Library of Congress or some other Authority files; WorldCat or OCLC or LC database. [more tool options, here]

    Nine Search Options:
    "Using the idea that there is ample information in both the brick-and-mortar library and the virtual library, Mann (Library of Congress) develops the volume around nine search methods: (1) using controlled vocabulary, (2) browsing subject-classified books, (3) keyword searching, (4) citation searching, (5) using related records, (6) using published subject bibliographies, (7) Boolean combination searching, (8) using experts, and (9) searching subject literature. Individual chapters cover a specific aspect of research and give numerous examples." (source: The Oxford guide to library research, by  Mann, Thomas)

    Nine Browse  Options: cited in an article Bester (2010).


    More on the same shelf:

    March 01, 2014

    365 Days HolyBook Reading Charts

    Christianity: 
    Additional resources @ Amazon.com

    Islam:
     Additional resources @ Amazon.com
    Judiasm:
    Additional resources @ Amazon.com

    Hinduism
    Additional resources @ Amazon.com
    Sikhism:
     Buddhism:
     Additional resources @ Amazon.com
    Bahai:
    On the same shelf: