Show, don't tell, is the bottom line here.
Websites have their own faces, features, facets, and factbites. Many are however not visualized. Interestingly, businesses and communication portals are now looking (not just at the surface and beyond), even at the inner self. This soul searching is good and hope it lasts longer. By the way, I am not alone in inviting attention to the Innernet (no spelling error) in a material world***
What follows is a visual of my two blogs' (or Website's) infostructure (not infrastructure, for a difference click
here). Click at any of the images, given below and you can visualize the true colors of the content.
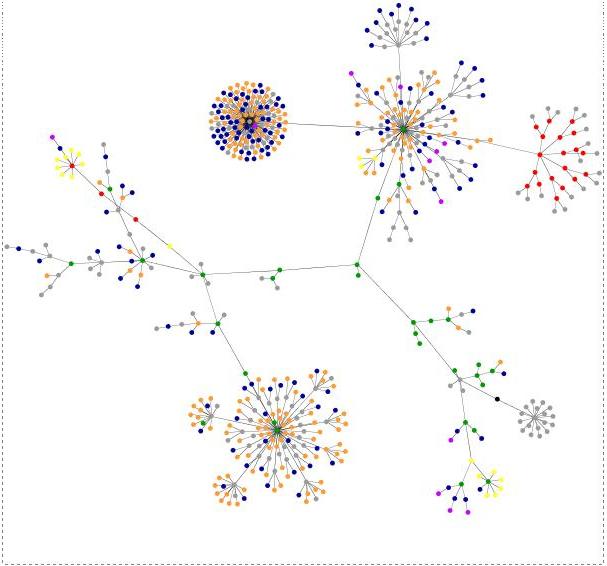
Image on the right:
Multifaith Hall of Fame of the 21st centuryImage on the left:
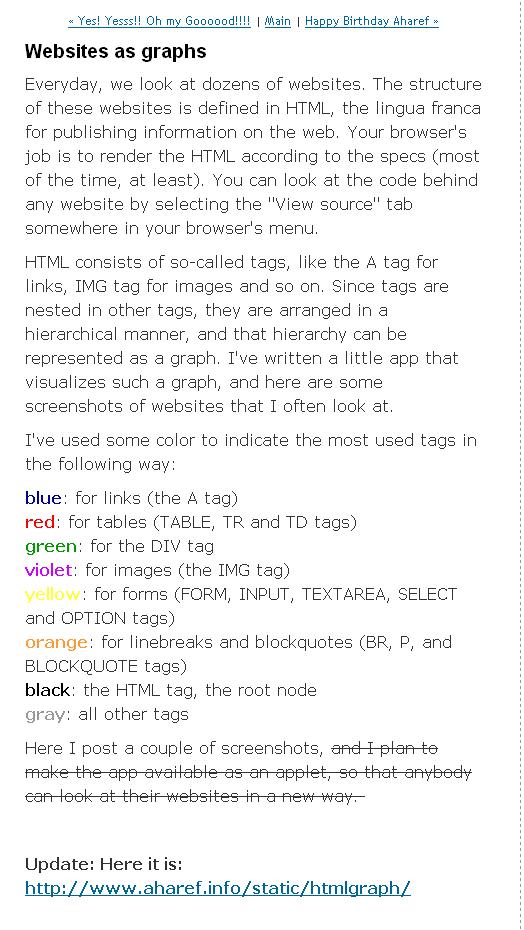
Blog As A Teaching ToolThe meaning of the colors in the above images is well stated by the author of aharef. See the following:
Acknowledgement: Thanks to Teblog of David Tebbutt for the information visualization tool, viz., Aharef's website-mapper.
I am amzaed by the way Ted has visualized this graphics: Website Structure (beautifully) Revealed [
details]. His tell tale is:
As a way of highlighting areas for improvement, this is brilliant. It is also quite hypnotic to watch the image evolve.
Ted has identified another source: Aharef’s Wikipedia site-map. Click and
VisualizeIncidentally, he was inspired by a master visualizer, Guillaume du Gardier. I envy Guillaume du Gardier for his PR and Communication skills. His blog is loaded (I mean it in a positive sense) with all types of graphics, images, and visuals [
view here].
A word about other graphics and applications that pre-date Aharef's website-mapper.Knowledge managers have been adopting this sense-making approach in their own ways. See Lennart Björneborn's doctoal work,
The Corona model with examples of link paths and reachability structures between different graph components in a web space (modified after the Bow-Tie model by Broder et al. 2000) [
Details]
~~~~Links are for use – the very essence of hypertext;
~~~~Every surfer his or her link – the rich diversity of links across topics and genres;
~~~~Every link its surfer – ditto;
~~~~Save the time of the surfer – visualizing web clusters and small-world shortcuts;
~~~~The Web is a growing organism
quoted in PhD dissertation in webometrics:
Small-World Link Structures across an Academic Web Space - a Library and Information Science Approach.
P.S.
"I didn't say a word. They did." Thus Spake Feroze Thank you Mr. Feroze for giving me this message in seven short words (amidst your thousand worded blog). You are a creative visualizer (see his blog:
my1000words). Thank you also for letting me learn that visuals speak on their own (we don't need to always use a 1000 words).
----
Similar Resources:
*** There are many more in this stream to give you such an insight:
Cover story of the May / June 2006 AIIM E-Doc Magazine, has a lead article on Be Serene: Channel you inner records manager, detials
Centre for Spirituality at Work "Fostering good karma a touchy subject; Spirituality is the 'last frontier' of workplace enightenment, but Wallace Immen finds interest in exploding, May 24, 2006 [You may find these articles of interest: An article from the www.Spirituality.com website about our Founding Director, Sherry Connolly, MBA, MDiv, DMin (cand.)]
Putting Reflection into Gear, BY : John Baldoni, [ON LEADERSHIP COMMUNICATION] 06/28/2006
Vertical and tacit: Multifaith and Knowledge Management in Perspective, details
Labyrinths, Sacred Geometry, Innernet & Visualization, details
See also: Richmond, Lewis. Work as a spiritual practice : a practical Buddhist approach to inner growth and satisfaction on the job (Broadway Books, c1999)