About this Blogsphere:

This blogsphere attempts to capture, catalog and share resources relating to visual perception of information. It is about a world mostly dealing with Physical (Touch, Taste, See/Sight, Smell and Hear) and sometimes Metaphysical (and that is none-of-the-above category). Physical, for instance, touch (e.g., feel, felt, found), look and visualization, is here with an attempt to combine verbal, vocal and visual--to synchronously see, hear, share and do much more. Interestingly, in order to visualize one does not need special skills, competencies, etc. It is all about common sense, especially with human visualizations. In short, "information is in the eye of the beholder." Continue reading much more all-ado-about this Blogosphere

Akbani is a Cutchi Memon family name.

October 23, 2006

Visualization - EBSCOhost’s cool new integration of Grokker

This is an old news. Ya.
But, a new perspective. I felt I had done my 2 cent's worth by including Grokker's feature in Web search visualization. But, now I find Grokker is with EBSCO and moreover, incorporated in the library search menu (precisely for searching in EBSCOhost’s databases), as described below:

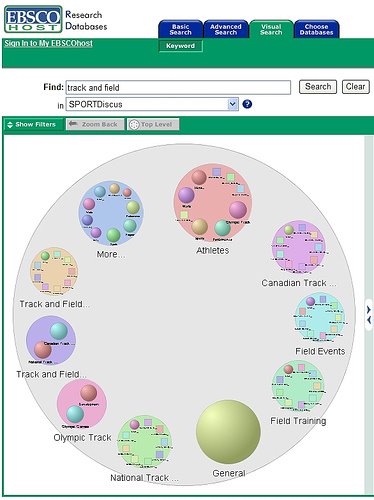
Visualization. This is what actually inspired this series of posts. I went to a demo recently of EBSCOhost’s cool new integration of Grokker (which my library supposedly has a trial subscription to, but it isn’t working right now). Grokker allows a multidimensional visual representation of search results, which includes clustering. If you’re not familiar with the concept, check out Grokker’s website. The whole thing is difficult to explain but incredibly simple to use. I wish Ebsco had adopted this 4 years ago; grad school would’ve been a whole lot easier.

The beauty of this type of visualization is manifold: It allows the user to see relationships. It allows the user to more easily refine searches based on immediate visual processing of results, and with other included tools like a time slider. It doesn’t require users to scan through page descriptions, which often are poorly written and not representative (less of a problem outside of the web). Most importantly, IT ISN’T UGLY, so users are more likely to use it. During the last usability study of my library’s website, users uniformly avoided using the “search this site” box because the results it returned were ugly and confusing, which is pretty difficult to avoid with text-based results. (I can’t even imagine the confusion they would’ve encountered had I tested them on our digital projects search engine; hopefullly we’ll be testing that later this year.) This is no way to treat users! continue reading @ digitize everything on searching Sweet Jesus, I hate (most) search interfaces! (part 2)


  • Visual Searching (in Flikr and EBSCO: above image), Posted by gsennema
  • Visualize This, By Judy Luther, Maureen Kelly, & Donald Beagle -- 3/1/2005, Library Journal [look for visualization, visualizers, visualizing tools, and corporate support for visual search]

    And the following news, re-read:
  • Groxis and EBSCO Publishing Partner to Provide Visual Search Technology
    Grokker Visual Search Now Available via EBSCOhost®

    My Webliography on Visual Catalogs:
  • Innovative Practices to Connect Every Book, Its Reader
  • Mining The Library Catalog
    My previous posts:
  • Information visualization, 23 Dec 2005 by Mohamed Taher
    For Yahoo search results via Grokker
  • Information Visualization Demystified, 16 Mar 2006 by Mohamed Taher
  • Visualizing the Innernet or Visual Display of the Website's ... 13 Jun 2006 by Mohamed Taher
  • October 03, 2006

    Guess your age?


    Outsell's Chuck Richard says "show me your primary information interface and I'll guess your age." Desktop = AARP member; Laptop = Baby Boomer; PDA = Cast of "Friends"; Cell Phone = more than three body piercings and sooooo under 35; Internet-connected video game console IM'ers = 14-to-28-year-old single males. continue reading


    My previous post on historicity:
  • History of the book: Writing on the Stone Slab
  • Information Visualization: From Aristotle, Plato, to the year 3706
  • September 26, 2006

    Today's rant - Touch it...

    judith meskill's knowledge notes...

    on knowledge notes...
    ...all abstract knowledge is only a faded reality: this is because to understand the world knowledge is not enough, you must see it, touch it, live in its presence and drink the vital heat of existence in the very heart of reality...

    Hymn of the Universe by Pierre Teilhard de Chardin

    September 21, 2006

    Communicating via graphics - Information Visualized

    Thus spake Dave, The Industrial Librarian, at his blog:

    I've discovered a great blog, Creating Passionate Users. This blog is worth checking out for the graphics alone, which are great at capturing the essence of the blog posting (very handy for those of us only scanning the postings....) Thanks Dave


    NB. By the way don't miss another graphics, creative visualization of The indexed Blog, whose profile states:
    This site is a little project that lets me make fun of some things and sense of others. I use it to think a little more relationally without resorting to doing actual math.

    September 14, 2006

    Information visualization and Documentation of the Infostructure

    What are the trends in information visualization? It is time that some effort is made to document, what, where, when, which, who and how of the information visualization is taking place. The following is one such trend and discussion:
    Information visualization conversation with Fernanda Viegas and Mike Migurski

    ""(...) if you look at the academic information visualization community, researchers aren't focusing on the social side of their applications. Infovis folks love to explore techniques that allow them to scale the data they are showing. But what happens when you scale the audience that's looking at a visualization?" (Peter Merholz - IDEA 2006 Blog) Continue reading


    Information and data visualizations seem to be taking off as artifacts suitable for sharing. I’m reminded of the buzz a couple years ago around extisp.icio.us, which visualized your del.icio.us tags (and this before the prominence of tag clouds). This allowed you to create a kind of visualized avatar of yourself. (Which in turn reminds me of “Personal Dictionaries”, an art project from 1995, where people’s additions to their word processor’s dictionary were overlaid on their photograph.) Keep reading

    September 02, 2006

    New this month - Come September

    My book just released.
    This book in short deals with what appeals the matter, as traffic of ideas & bandwidth in business world; and what appeals the soul, as a journey towards the transcendental in order to get the required spiritual care for our daily life)

    Click here for details:


    Cyber Worship in Multifaith Perspectives, Mohamed Taher